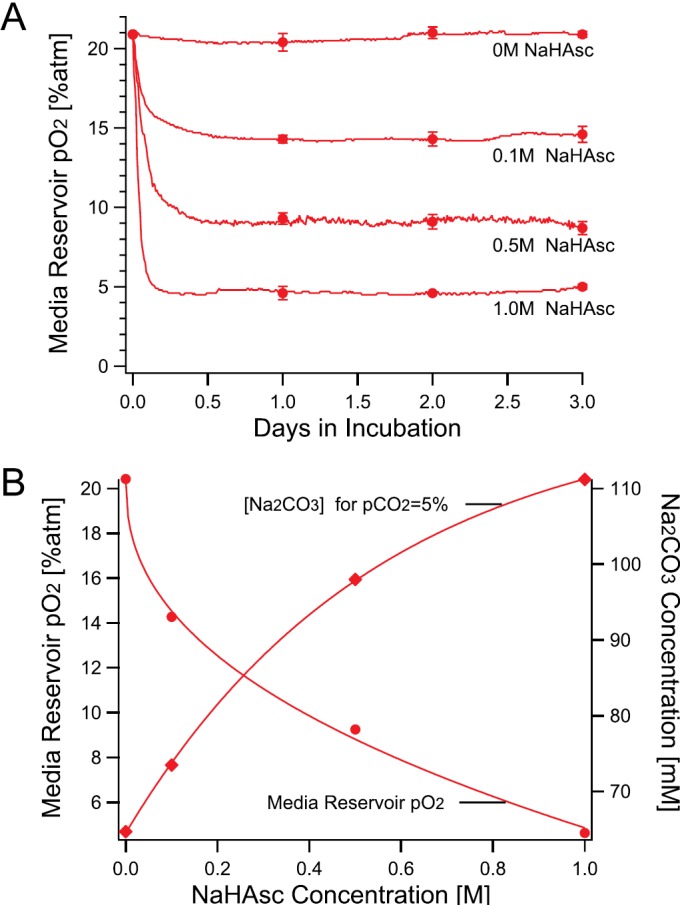
FIG. 2.

Hypoxic conditioning of the microfluidic chip with NaHAsc. (a) Time evolution of partial O2 pressure (pO2) measured in the media reservoir in contact with jacket solutions containing 0.8 M NaHCO3, 65 mM Na2CO3, and different concentration of NaHAsc. Observed typical pO2 values at 10-min intervals are plotted as lines; the average values at 24, 48, and 72 h are plotted as representative values (N = 3, ±SD). (b) The relationship among the NaHAsc concentration, the media reservoir pO2, and the Na2CO3 concentration when the media reservoir pCO2 is 5% on Day 1. Interpolated Na2CO3 concentrations values at pCO2 = 5% atm shown in (a) with corresponding NaHAsc concentrations were plotted.
