
Fig. 4.
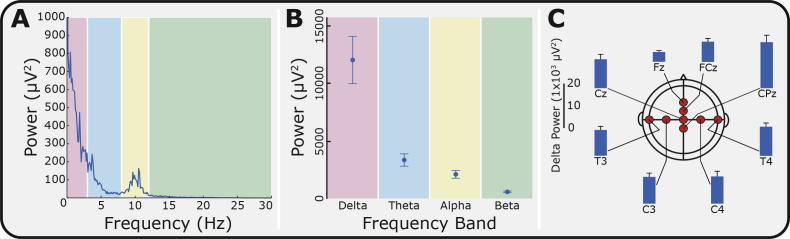
Power-spectra for background electroencephalogram (EEG). (A) Average power spectrum of the background EEG across all channels (Naïve group; n = 28). The spectrum was divided into 4 frequency bands: delta (0–3 Hz, red), theta (3–8 Hz, blue), alpha (8–12 Hz, yellow), and beta (12–30 Hz, green). (B) Comparison of the power in the background EEG in each frequency band. (C) The delta power in the background EEG at each of the EEG channels. Error bars indicate SEM.