
Supplementary Fig. 1.
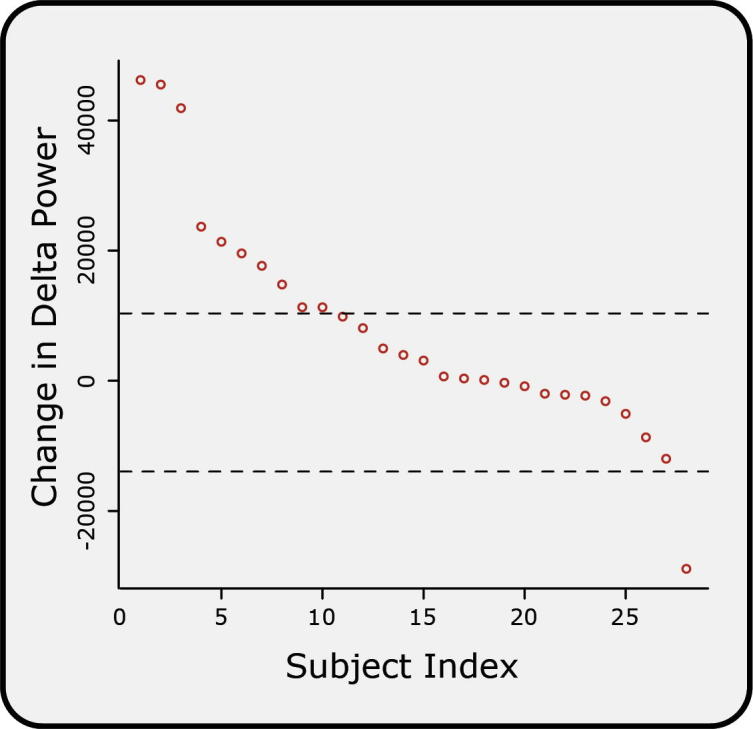
Change in delta power in individual subjects. Individual subjects were ranked according to change in delta power between cannulation and background. Dashed lines indicate the mean ± SD of the change in delta power between the background periods.