
Fig. 2.
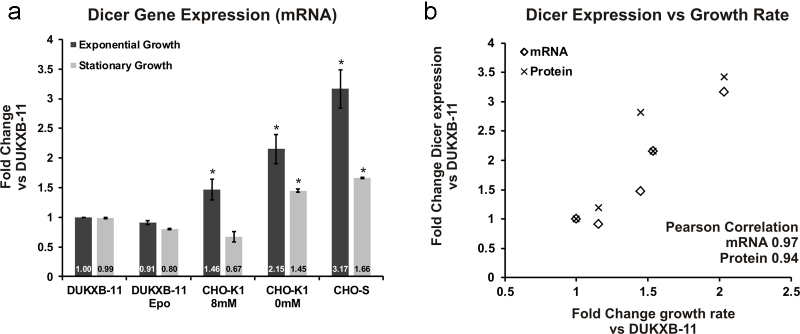
Dicer expression correlates with growth-rate in protein-free and suspension adapted CHO cell lines. (a) qPCR analysis of Dicer transcript levels at two time-points during batch cultivation is shown (dark, exponential growth phase; bright, stationary growth phase). Fold changes are given relative to Dicer levels in DUKXB-11 host cells (n = 3 per group, Actb used as reference gene, error bars represent s.d. of mean). Significance tests were performed using pairwise Student’ T-test between DUKXB-11 and each cell line. Significant differences (p < 0.05) are marked with an asterisk (*). (b) Scatter plot depicting the relationship between specific growth rate and Dicer expression on mRNA (rectangle) and protein (cross) level. Shown are fold changes in expression relative to DUKXB-11 host cells.