
Figure 3.
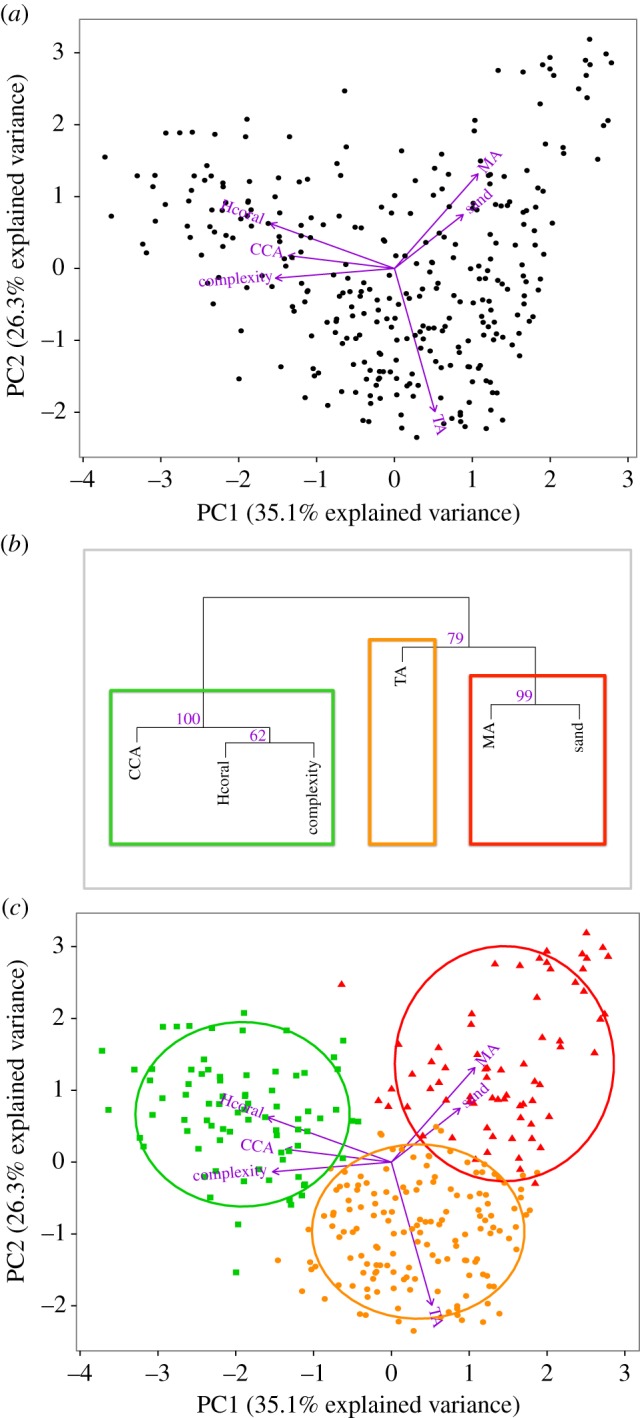
(a) Principal component analysis (PCA) diagram showing the spatial variation in benthic habitat of 302 sites in the Hawaiian archipelago along the first two principal components. Variables are plotted as vectors and dots represent sites. The smaller the angle between two variable vectors the stronger the correlation. Hcoral, hard coral cover; MA, macroalgae cover; CCA, crustose coralline algae cover; TA, turf algae cover; sand, sand cover; complexity, structural complexity. (b) Cluster dendrogram of the benthic variables from 302 sites, with p-values given as percentages. For a cluster with p > 95%, the hypothesis that ‘the cluster does not exist’ is rejected with significance level 0.05. (c) PCA diagram with an overlaying K-means clustering of the sites. Green squares (80 sites), orange circles (153 sites) and red triangles (69 sites) represent categorization of the sites matching the previous hierarchical grouping of the benthic variables. The ellipses encompass 80% of the dots associated with each cluster.