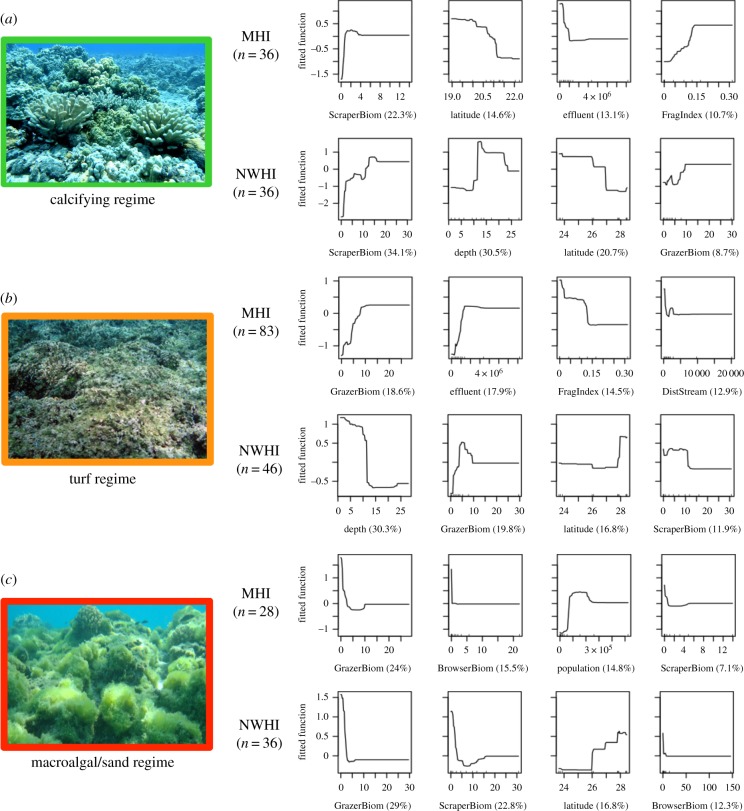
Figure 4.
Partial dependency plots for the four most influential variables in the boosted regression trees analysis of three distinct benthic regimes (a–c) in the MHI and the NWHI. Number of sites within each region and relative influence of each predictor are shown in parentheses. Photo credits: NOAA.

