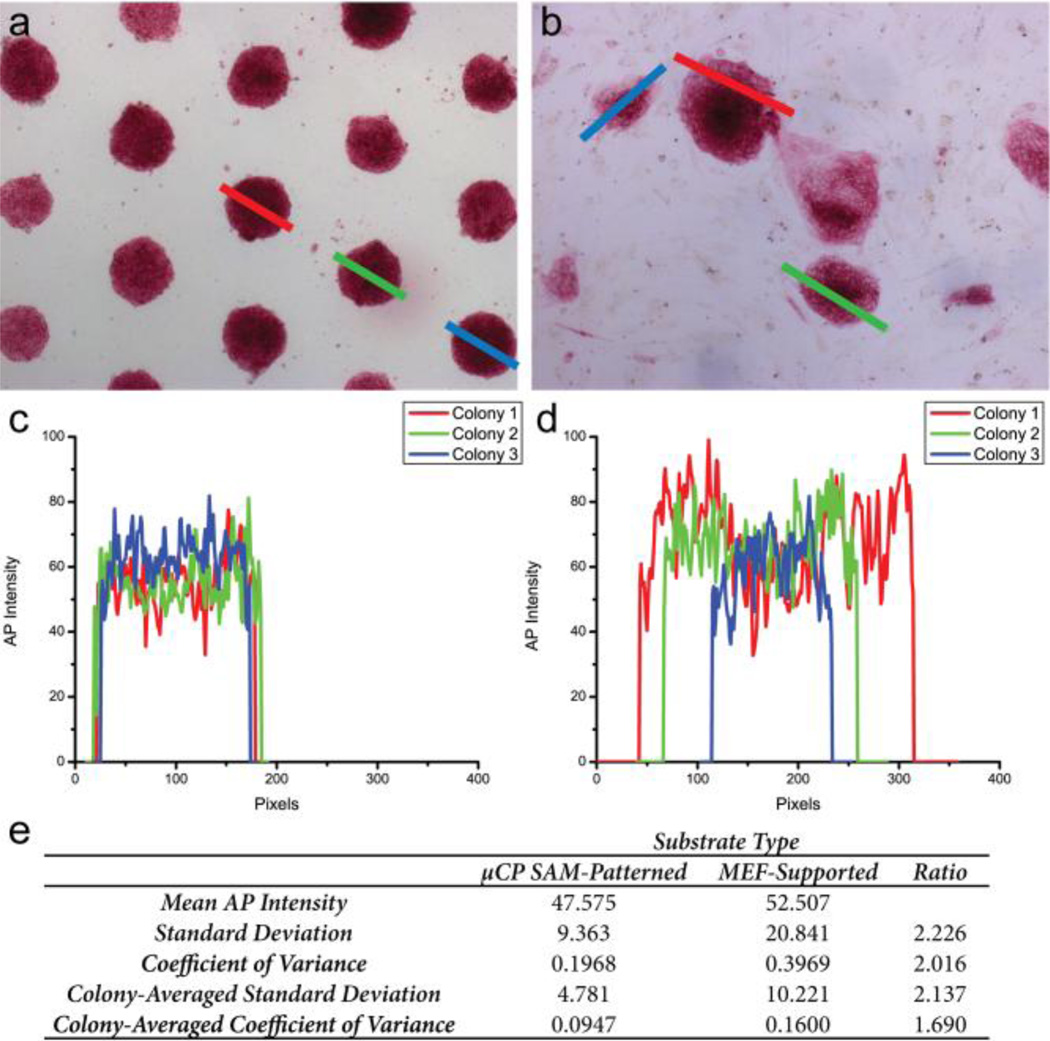
Fig. 4.
Representative images of µCP-patterned colonies (a) and MEF-supported colonies (b). The lines drawn across the indicated colonies represent the path of the intensity profiles measured for individual colonies. Line colors correspond to the plots of AP intensity displayed in c,d. (e) Comparison of AP-staining intensities from µCP SAM-patterned and MEF-supported populations. Results expressed as calculated standard deviations and average coefficient of variance, defined as the ratio of the standard deviation to the mean. hPSC cell line: H9 hESC (WiCell).

