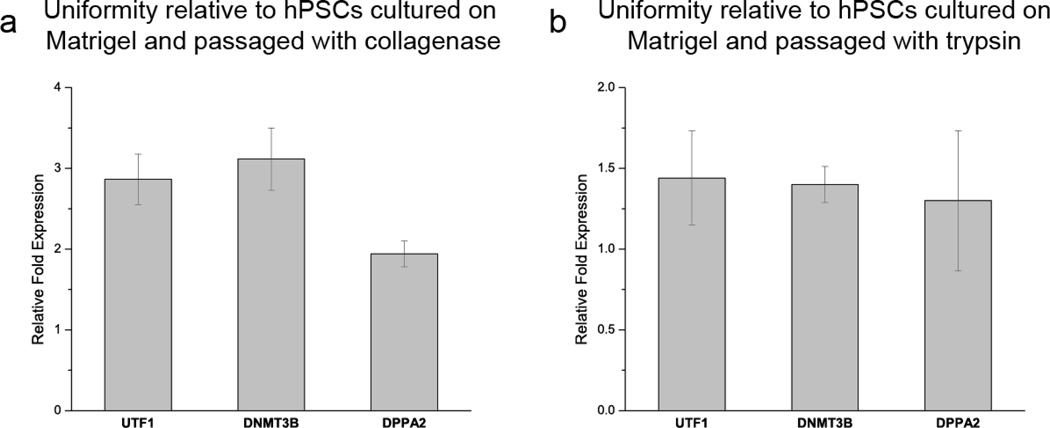
Fig. 5.
qPCR analysis of the expression of the pluripotency markers UTF1, DNMT3B, and DPPA2 indicates that there is less variability in micropatterned hPSC populations compared to unpatterned Matrigel controls passaged with either (a) collagenase or (b) trypsin. Relative fold expression was calculated by normalizing the expression level for each pluripotency marker to the housekeeping gene GAPDH through a threshold cycle (Ct) value comparison.

