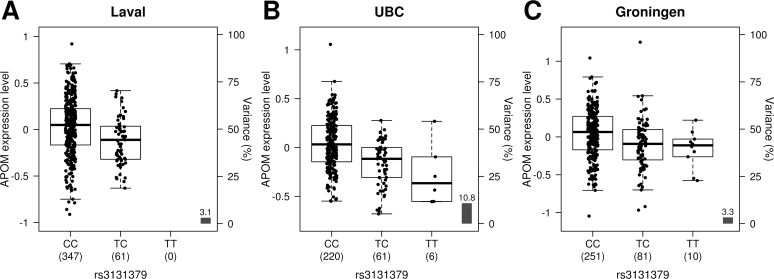
Fig. 4.
Gene expression levels of the APOM gene in the lungs according to genotyping groups for the SNP rs3131379 in French Canadian (A; n = 408; P = 3.58×10⁻⁴), in UBC (B; n = 287; P = 1.11×10⁻⁸) and in Groningen (C; n = 342; P = 6.84×10⁻⁴). The y-axis represents gene expression levels in the lung. The x-axis represents the three genotyping groups for SNPs rs3131379 with the number of subjects in parenthesis.

