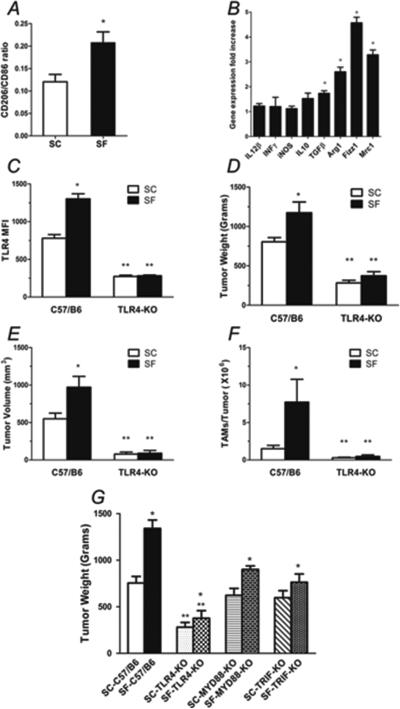
Figure 4. TAM polarity and TLR4 signaling.
A) TAM (CD45+ CD11b+ F4/80+) flow cytometric assessment for the proportion of CD 86high, a M1 marker or CD 206high, a M2 marker, showing a shift toward increased M2 marker expression in TAM of SF-C57/B6 tumors (n=6). B) RT-PCR gene expression analysis of TAM, showed a shift in polarity in SF tumors with higher expression of M2 markers (Fizz1, Arg1 and Mrc1) when compared to SC conditions (n=6). C) TAM from SF-exposed mice expressed higher levels of TLR4 compared to SC-exposed mice (n=6). D&E) SC-TLR4−/− mice injected with TC1 tumor cells had a significantly reduced tumor weight and size when compared to SC-C57/B6 mice (n= 20/ group). Moreover, the accelerated growth and increased size induced by SF exposures were completely abrogated in SF-TLR4−/− mice (n=20). F) FACS assessment of TAM (CD45+ CD11b+ F4/80+) counts in tumors from TLR4−/− compared with C57/B6 conditions shows complete abrogation of the effect of SF, with significant reductions in TAM count in SF-TLR4−/− mice ( n=20). G) Tumors weight at enucleation after 28 days of TC1 tumor cells injection in C57/B6 wild type, TLR4−/−, MYD88−/− and TRIF−/− mice, shows that tumors in SF-MYD88−/− and SF-TRIF−/− mice had reduced tumor weight compared to SF-C57/B6, but still significantly larger than in SF-TLR4−/− mice (n=12/group). In addition, small, albeit statistically significant differences between SF and SC for MYD88 and TRIF null mice remained. *p< 0.05 when comparing SC vs. SF conditions; **p<0.05 when comparing different strains.

