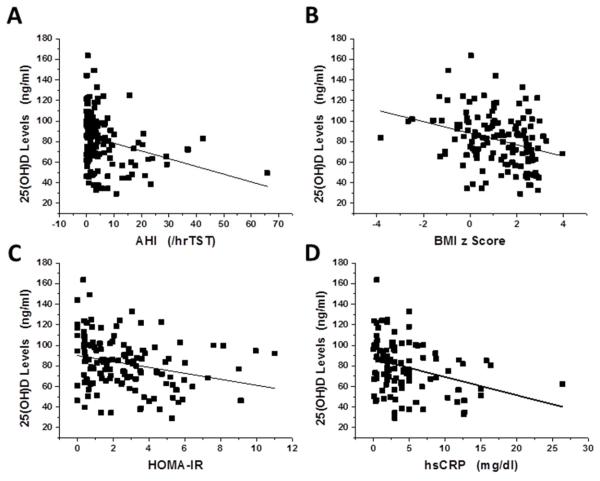
Figure 1. Scatterplots of 25(OH)D plasma levels vs. BMI z score, obstructive apnea hypopnea index (AHI), nadir SpO2, hsCRP, and HOMA-IR expression in a cohort of 176 children with and without obesity or OSA.
Panel A - r=−0.285, p<0.001
Panel B - r=−0.302, p<0.0001
Panel C - r=−0.259, p<0.001
Panel D - r=−0.318, p<0.001

