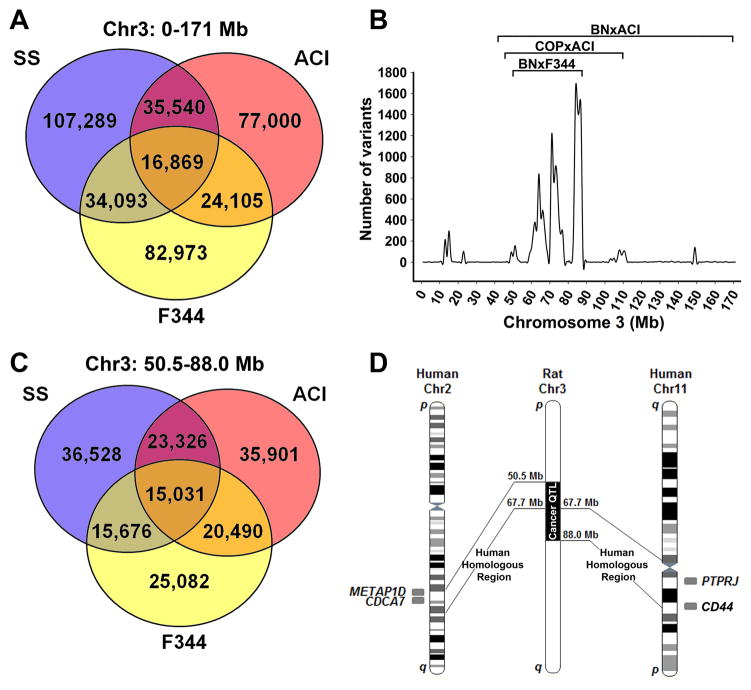
Figure 6.
Sequence analysis of cosegregating alleles and comparative mapping of rat chromosome 3. (A) Venn diagram of sequence comparison the entire rat chromosome 3 between variants shared by the cancer-resistant BN/NHsdMcwi and Cop/Crl strains versus the cancer-susceptible strains ACI/Eur, F344/N, and SS/JrHsdMcwi. (B) Density mapping of variants shared by the cancer-resistant BN/NHsdMcwi and Cop/Crl strains versus the cancer-susceptible strains ACI/Eur, F344/N, and SS/JrHsdMcwi. Data are presented as the number of variants per 1 Mb bin. Note the highest density of cosegregating variants overlap with three breast cancer QTLs (labeled brackets). (C) Venn diagram of sequence comparison the shared QTL region of chromosome 3 (50.5–88.0 Mb) between variants shared by the cancer-resistant BN/NHsdMcwi and Cop/Crl strains versus the cancer-susceptible strains ACI/Eur, F344/N, and SS/JrHsdMcwi. (D) Schematic representation of the overlapping cancer QTLs on rat chromosome 3 and the orthologous regions in human. The overlapping human breast cancer loci indicated on the figure.

