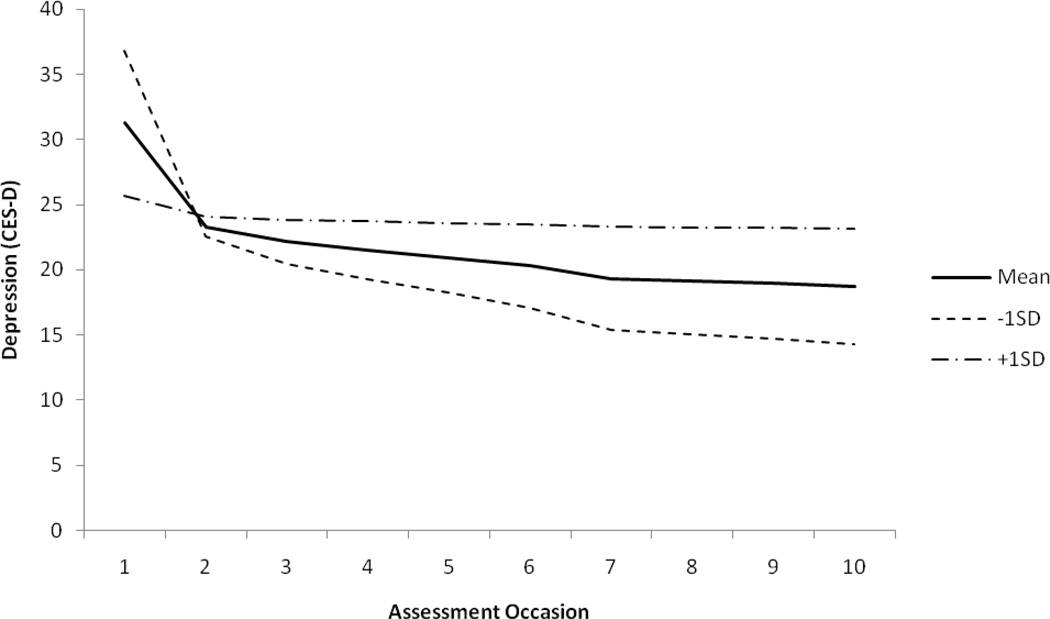
Figure 1.
Depiction of the unconditional change model with Time modeled as the natural log transformation of the number of days since the initial assessment. The solid line depicts the mean level of change across all participants. The dashed lines are included to illustrate the variability in change present in the sample and depict change at 1 SD above and below the mean level of change. Note: Because the mean of the slope paramter was negative 1 SD below the mean represents faster (steeper) decreases, while 1 SD above the mean represents slower (flatter) decreases.

