Figure 5.
LC-MS/MS-Based Abundance Profiling Can Be Used to Predict the Protein Complex Formation.
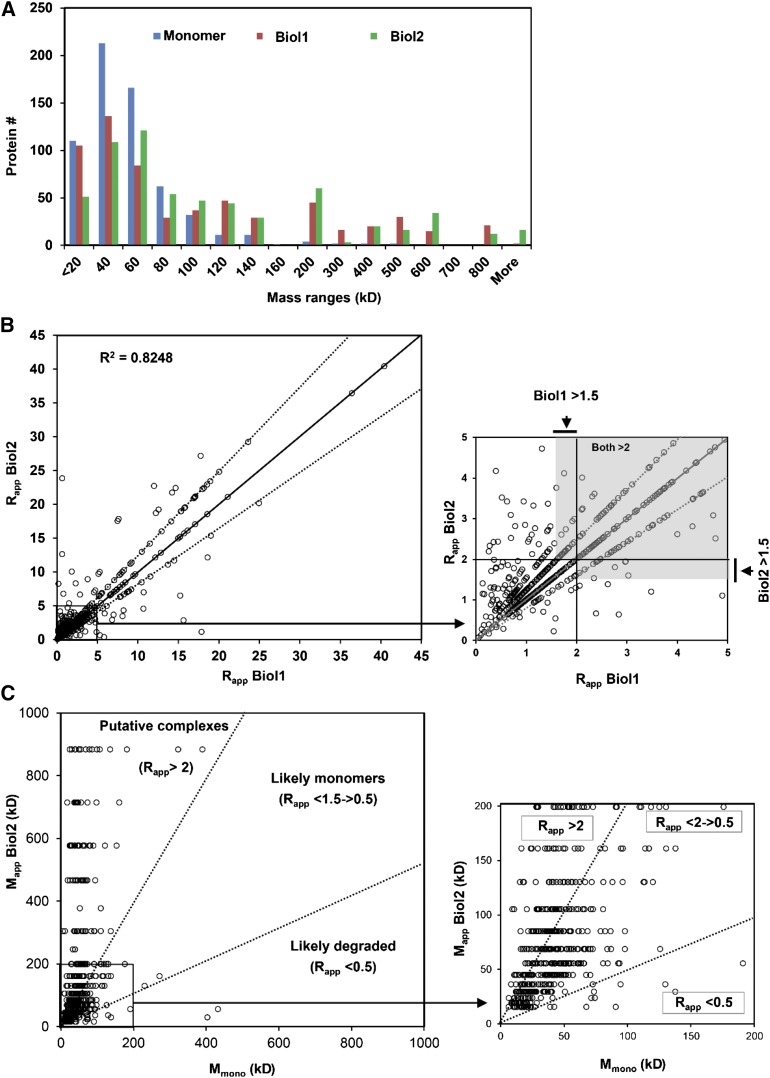
(A) Histogram showing the different distributions of the monomeric (blue) and experimentally determined apparent masses (green and red) of the cytosolic proteins that were quantified in both biological replicates.
(B) Scatterplot showing Rapp distribution of 648 cytosolic proteins. Circles represent Rapp values. The proteins (∼78%) were identified with reproducible Rapp scores between the two replicates within 0 to 2 fraction shifts in SEC elution profiles. Inset: zoomed view of the boxed region of the plot indicating in gray the Rapp thresholds that were used in borderline cases to predict protein complex formation.
(C) Graphical display of oligomerization state of cytosolic proteins. Scatterplots of the apparent and the monomer masses of proteins in replicate 2 (inset: zoomed view of the boxed region of the plot).

