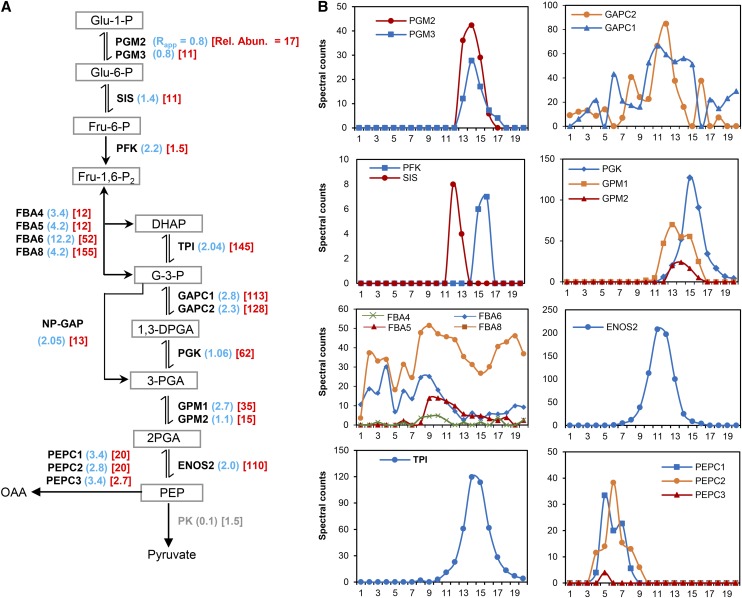
Figure 6.
Oligomerization State of Enzymes in the Cytosolic Glycolytic Pathway.
(A) Overview of the cytosolic glycolytic pathway showing the enzymes and their substrates. Adjacent to each enzyme is the Rapp score (blue) and the enzymes relative abundance (red). The enzymes catalyzing each reaction and detected in this study are illustrated by symbols as follows: PGM, PHOSPHOGLUCOMUTASE; SIS/GPI, SUGAR ISOMERASE/GLUCOSE-6-PHOSPHATE ISOMERASE; PFK, PHOSPHOFRUCTOKINASE; FBA, FRUCTOSE BISPHOSPHATE ALODOLASE; TPI, TRIOSEPHOSPHATE ISOMERASE; GAPC, GLYCERALDEHYDE-3-PHOSPHATE DEHYDROGANSE C SUBUNIT; ALDH/GAPN, ALDEHYDE DEHYDROGENASE/NADP-DEPENDENT GLYCERALDEHYDE-3-PHOSPHATE DEHYDROGENASE; PGK, PHOSPHOGLYCERATE KINASE; GPM, PHOSPHOGLYCERATE MUTASE; ENOS, ENOLASE; PEPC, PHOSPHOENOLPYRUVATE CARBOXYLASE; PK, PYRUVATE KINASE. The abbreviations are as follows: Glu-1-P, glucose-1-phosphate; Glu-6-P, glucose-6-phosphate; Fru-6-P, fructose-6-phosphate; Fru-1,6-P2, fructose-1,6-bisphosphate; DHAP, dihydroxyacetone phosphate; G-3-P, glyceraldehyde-3-phosphate; 1,3-DPGA, 1,3-diphosphateglycerate; 3-PGA, 3-phosphoglycerate; 2-PGA, 2-phosphoglycerate; PEP, phosphoenolpyruvate; OAA, oxaloacetate. Arrows indicate the direction of the reaction. → Indicates physically irreversible reaction, or ⇌ indicates physically reversible reaction. Numbers in parentheses represent the Rapp values for replicate 2 (blue) and the scaled relative abundance values (red). Rel. Abun., relative abundance.
(B) Elution profiles of detected glycolytic enzymes shown in (A). Profiles are organized in columns to reflect their order in the pathway.

