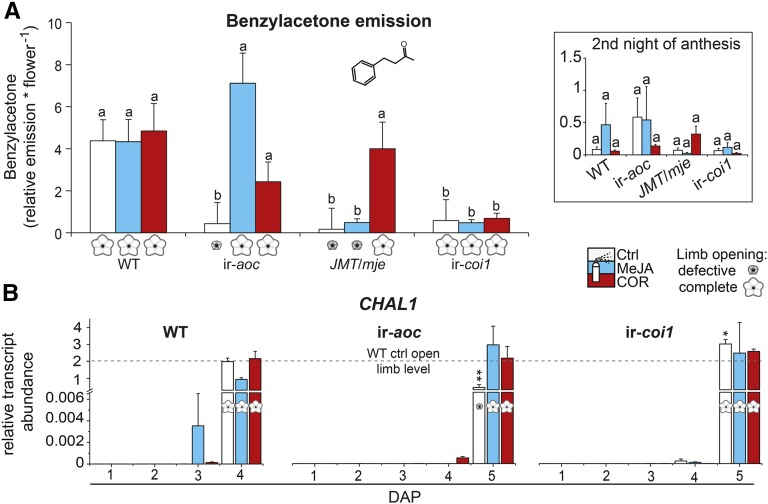
Figure 7.
BA Emission and CHAL1 Expression Are Differentially Affected in JA Biosynthesis/Perception-Deficient Flowers.
(A) Relative floral emission of BA (means + se; n = 11 to 17) for wild-type, ir-aoc, JMT/mje, and ir-coi1 flowers during the first night and the second night (inset) of anthesis. Buds of flowers monitored for BA emission had previously been treated every other day for 10 d with control (Ctrl), 100 μM MeJA, or 1 μM COR solution. A two-factor ANOVA with factor treatment and factor genotype revealed significant effects: Ftreatment = 4.98 (P < 0.008), Fgenotype = 22.68 (P < 0.000), and Ftreatment × genotype = 6.445 (P < 0.000). Different letters indicate significant differences in a Bonferroni-corrected posthoc test following an ANOVA (P < 0.05).
(B) Transcript abundance (relative to EF1α gene expression) of CHAL1 in dissected corolla tissues of wild-type, ir-aoc, and ir-coi1 plants at the indicated DAP and treatments (means + se; n = 3). Each replicate was obtained from 20+ pooled tissues of three plants. Asterisks represent significant differences between wild-type control (ctrl) and treated transgenic flowers at anthesis (unpaired t test; *P < 0.05, **P < 0.001).
[See online article for color version of this figure.]

