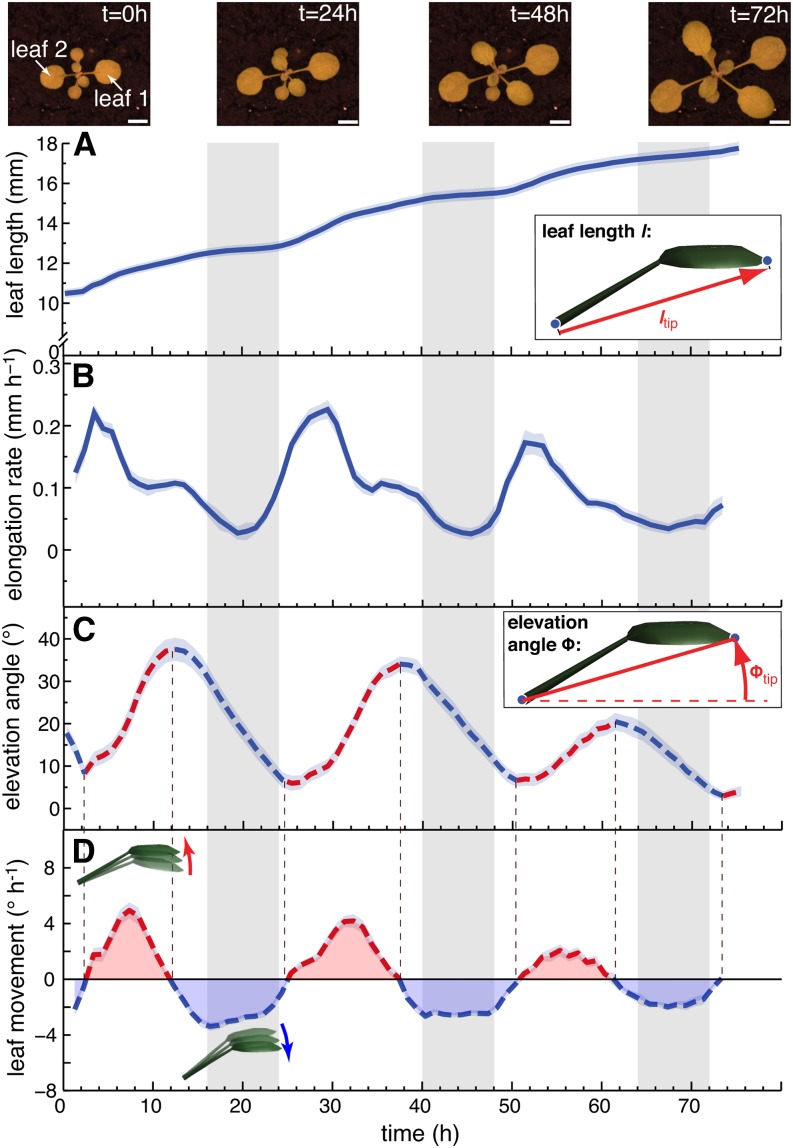
Figure 3.
The Pattern of Leaf Growth and Movements in Constant Light.
Length (A), elongation rate (B), elevation angle (C), and movements (D) (angular rate of change) of leaves 1 and 2 in continuous day (L/L) measured on 43 leaves (30 plants). ltip ([A] and [B]) and Φtip ([C] and [D]) were used to compute the graphs. Images on top show a representative plant at times (t = 0, 24, 48, and 72 h) during the experiment (bar = 5 mm). Parts of the graph in (C) highlighted in red represent phases of upward and parts highlighted in blue phases of downward movement. Col-0 plants were grown for 14 d in standard L/D conditions. At time 0 h (ZT0), lights were switched on for imaging and kept on in L/L. Vertical gray bars represent subjective night periods. Leaf elongation rate was computed as mean moving average (3 h) of 43 individual curves. Leaf elevation angle and movement rates are mean values. The opaque band around the mean lines is the 95% confidence interval of mean estimate.

