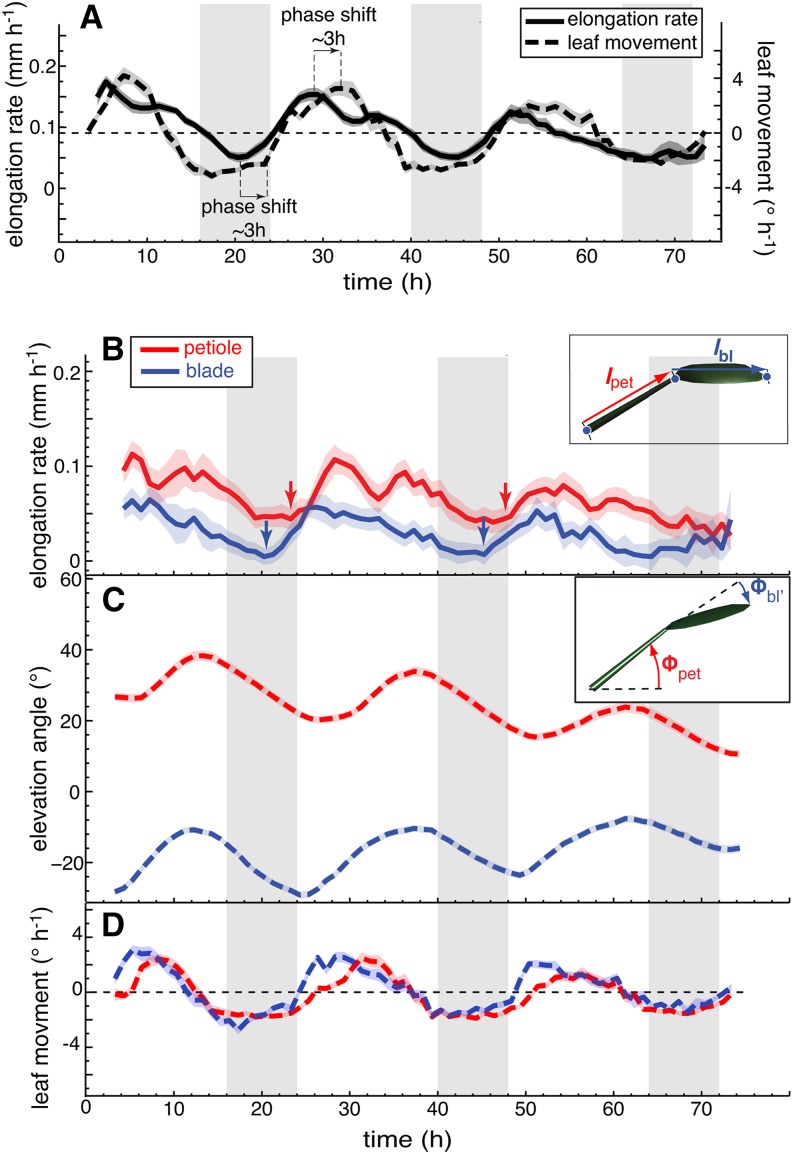
Figure 4.
Blade and Petiole Movements Contribute to the Leaf Hyponastic Response.
(A) Leaf elongation rate and leaf movements (angular rate of change) of leaves 1 and 2 in continuous day were replotted from Figures 3B and 3D for better direct comparison.
(B) to (D) Leaf elongation rate (B), leaf elevation angle (C), and leaf movements (D) (angular rate of change) of petioles (in red) and blades (in blue) of leaves 1 and 2 in continuous day (L/L) measured on 32 leaves. Col-0 plants were grown for 14 d in standard L/D conditions. At time 0 h, lights were switched on for imaging and kept on in L/L. Vertical gray bars represent subjective night periods. Leaf elongation rate is computed as mean moving average (3 h) of 32 individual curves. Leaf elevation angle and movement rates are mean values. The opaque band around the mean lines is the 95% confidence interval of mean estimate. Arrows indicate acceleration of growth.

