Figure 1.
ORA59 Binds to the Promoter of NRT1.8 and Modulates Its Expression.
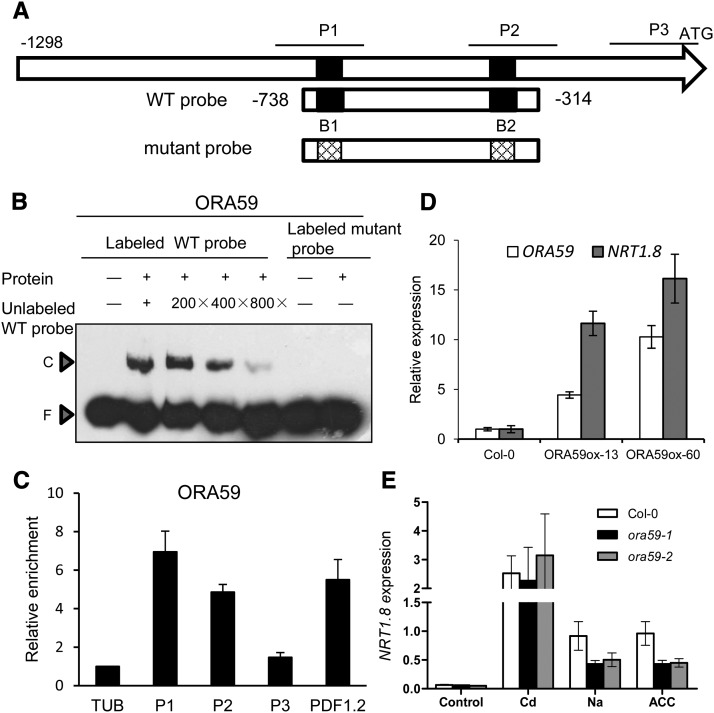
(A) Schematic diagram of the 1298-bp promoter fragment upstream of the NRT1.8 start codon. P1 (−795 to −634) and P2 (−410 to −233), covering the predicted GCC boxes B1 and B2, as well as P3 (−160 to −7), serving as a negative control, indicate promoter regions subjected to the ChIP-qPCR assay in (C). The wild-type probe used for the EMSA in (B) contains the wild-type GCC boxes (5′-AGCAGCC), while the mutant probe contains the mutagenized GCC boxes (5′-ATCATCC) where G was mutagenized to T.
(B) EMSA determination of complex formation between ORA59 and the NRT1.8 promoter. Wild-type and mutant probes, as indicated in (A), were amplified using the primers listed in Supplemental Table 1. Competition assay for the labeled wild-type probe was performed by adding 200-/400-/800-fold excesses of unlabeled wild-type probe. C, DNA-protein complex; F, free probe.
(C) ChIP assay using IgG beads to precipitate ORA59-TAP protein followed by qPCR detection of P1, P2, and P3 regions as indicated in (A). TUB2 and PDF1.2 were used as internal and positive controls, respectively. Data are means ± sd, n = 3.
(D) Quantitative RT-PCR analysis of NRT1.8 and ORA59 expression in roots of wild-type and ORA59-overexpressing plants grown in hydroponics. Values are means ± sd, n = 3.
(E) Quantitative RT-PCR analysis of NRT1.8 expression in roots of 4-week-old wild-type, ora59-1, and ora59-2 plants treated with 200 μM CdCl2, 150 mM NaCl, or 20 μM ACC for 6 h. NRT1.8 expression levels were normalized to those of SAND.
Values are means ± sd; n = 3.

