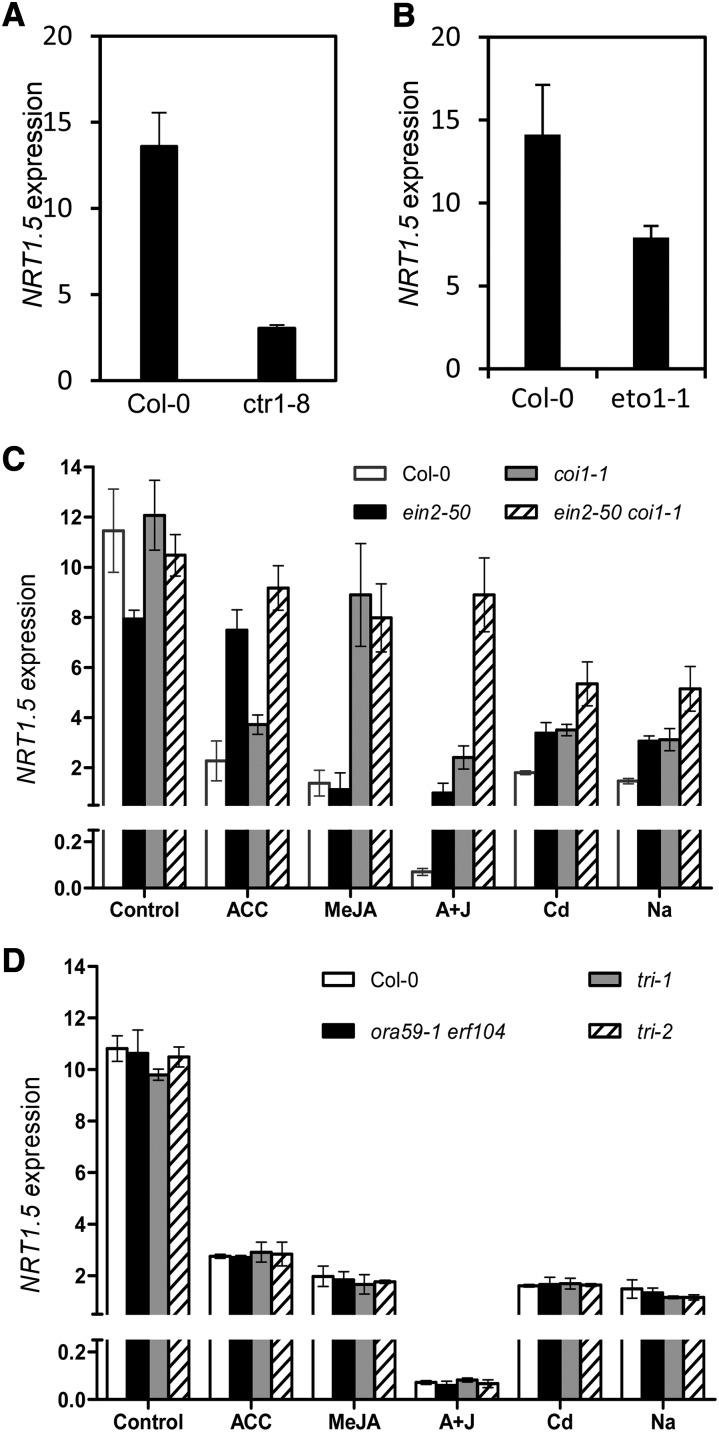
Figure 4.
Stresses Inhibit NRT1.5 Expression through ET/JA Signaling.
Four-week-old plants under control conditions or exposed to 20 μM ACC, 50 μM MeJA, 20 μM ACC + 50 μM MeJA (A+J), 200 μM CdCl2, or 150 mM NaCl for 6 h as indicated. The expression levels of NRT1.5 were determined by quantitative RT-PCR. Data were normalized to those of SAND. Values are means ± sd; n = 3 to 4.
(A) and (B) NRT1.5 expression in roots of ctr1-8 (A), eto1 (B), and their wild-type control Col-0.
(C) NRT1.5 expression in roots of ein2-50, coi1-1, ein2-50 coi1-1, and Col-0 plants.
(D) NRT1.5 expression in roots of ora59-1 erf104, tri-1, tri-2, and wild-type control plants.

