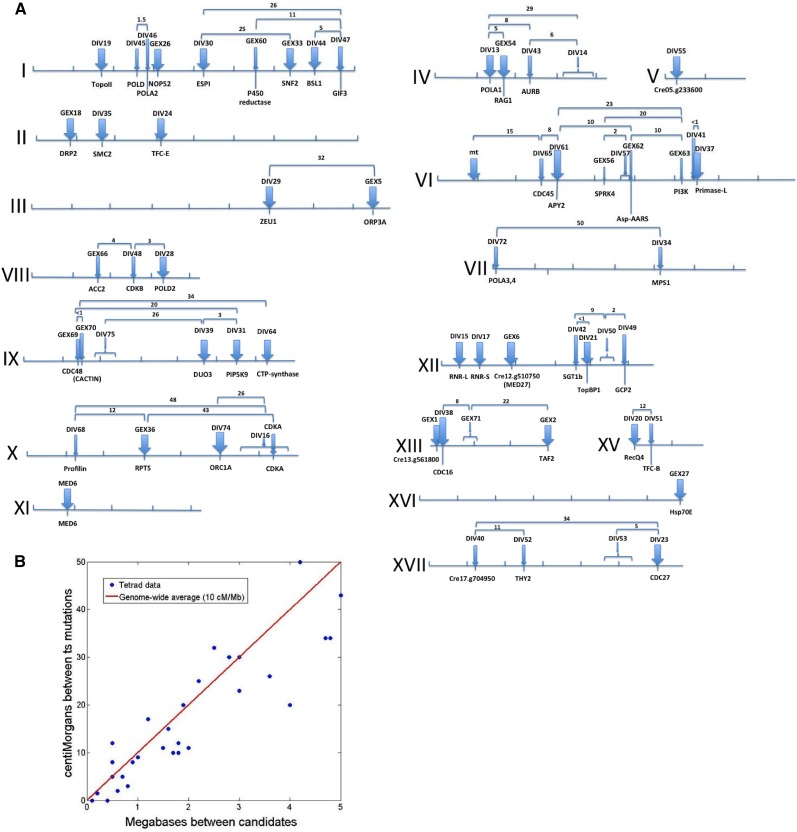
Figure 4.
Genomic Positions of DIV and GEX Genes.
(A) Maps of chromosomes I-XVII. Tick marks, megabases (Mb); thick blue arrows, definitively identified genes (multiple alleles or coreversion; see text); thin blue arrows, most likely identified genes (Tables 1; Supplemental Data Set 1); numbers, measured distance (centimorgans) between the indicated mutations from tetrad analysis (20 to 100 tetrads/cross).
(B) Correlation between physical positions of candidate SNPs and genetic distance (centimorgans [cM]) between mutant loci (data from [A], excluding crosses with predicted distance >4 Mb due to expected higher errors and deviation from linearity at large distances). The genome-wide average of 10 cM/Mb (red line; Merchant et al., 2007) explains 92% of the variance, and the residuals are symmetrical about zero (−1.6 ± 4.7 cM). This close correlation supports the assignments of causative mutations.
[See online article for color version of this figure.]

