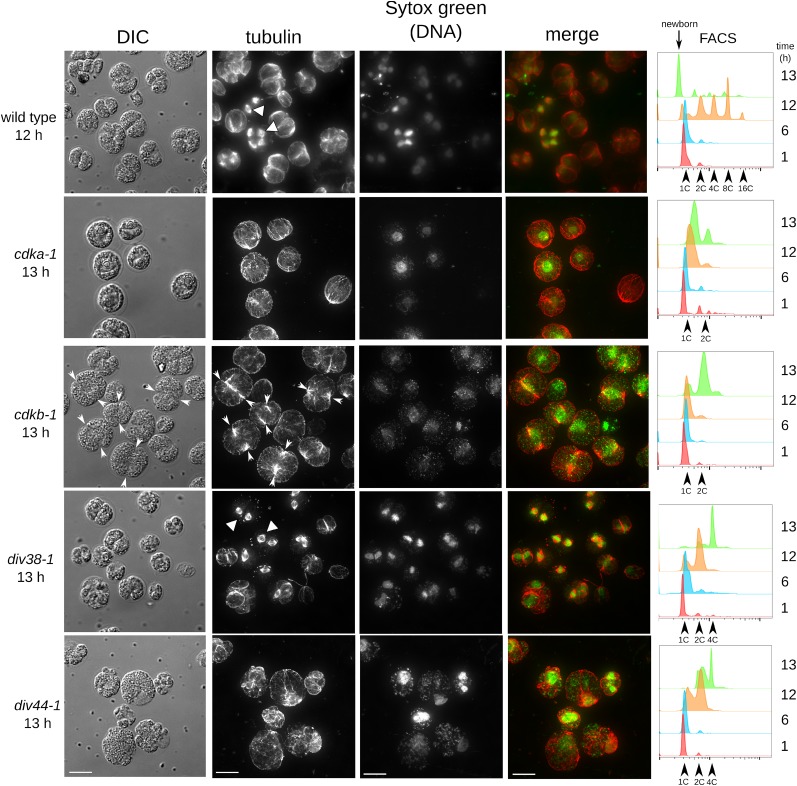
Figure 6.
Distribution of Tubulin and DNA in Arrested Mutants.
Parallel plates of wild-type and mutant strains (cdka-1, cdkb-1, div38-1, and div44-1) were shifted to 33°C at time zero. Tubulin was visualized by anti- α-tubulin indirect immunofluorescence (white triangles: mitotic spindles). DNA was stained with Sytox green. In cdkb-1, white arrowheads indicate location of the notch. DNA content was assayed at 1, 6, 12, and 13 h by FACS (right panel). Images are maximum projections of stacks of ∼30 deconvolved images. Images have been linearly modified to enhance contrast. Bars = 10 μm.

