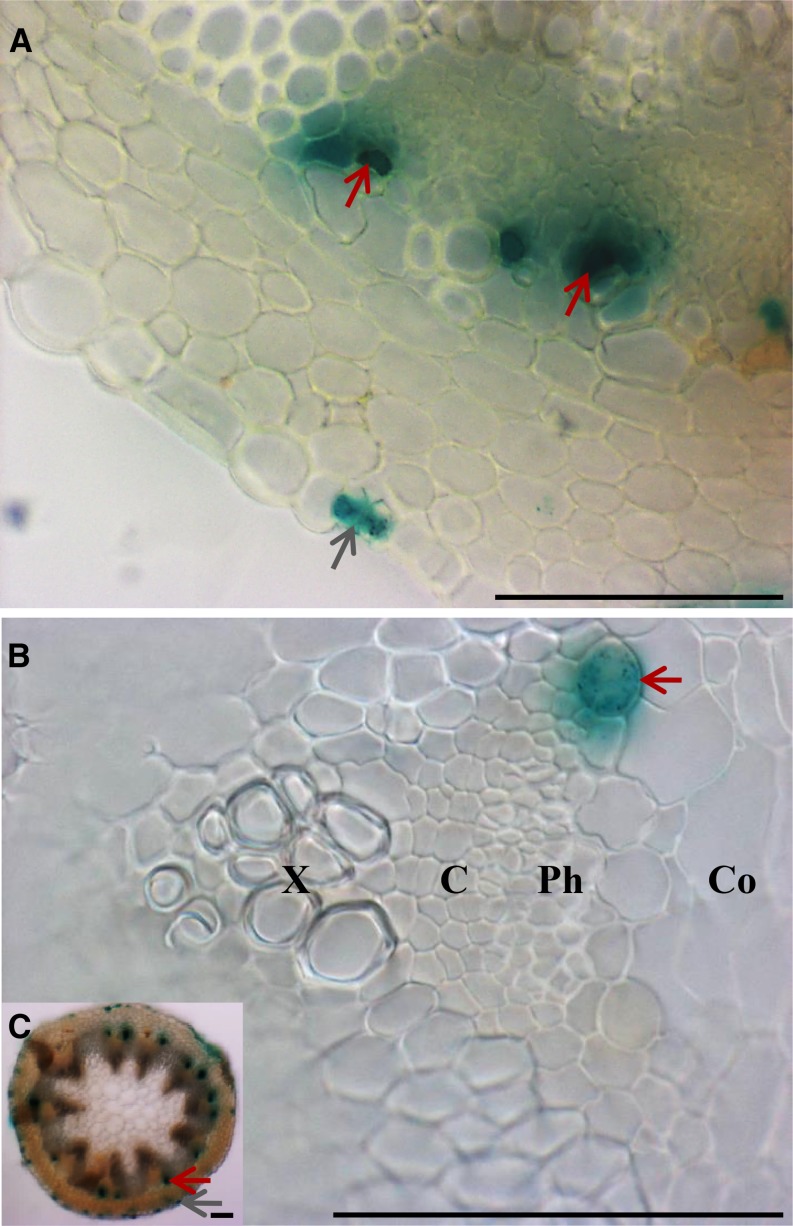
Figure 2.
FAMA Promoter-Driven GUS (ProFAMA:GUS) Expression in MIs in Stems.
Red and gray arrows indicate GUS expression in MIs and GCs, respectively. X, xylem; C, vascular cambium; Ph, phloem; Co, cortex. All three images were from hand sections of stems 2 weeks after bolting and were captured using light microscopy. Bars = 0.1 mm.

