Figure 4.
Loss-of-Function Phenotypes of GCs and MIs in fama-1 Leaves.
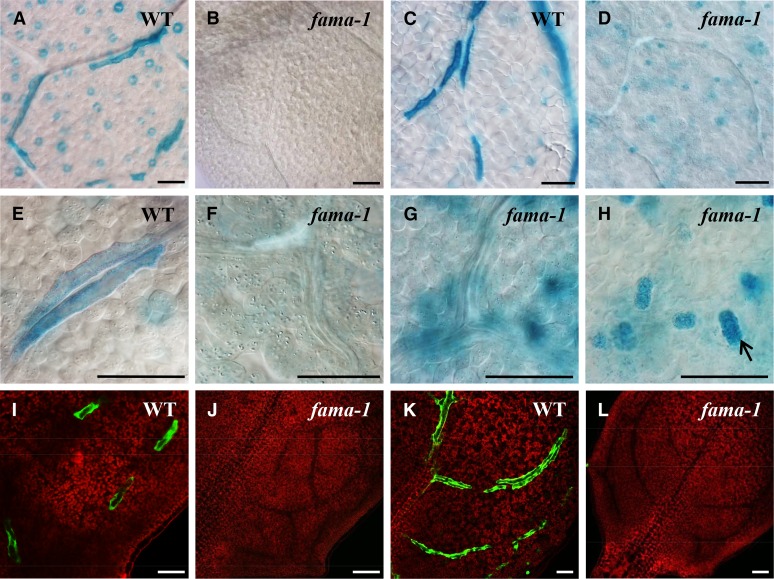
(A) Wild type showing ProTGG1:GUS expression in stomata and in MIs.
(B) Whole mount of leaf showing that fama-1 lacks ProTGG1:GUS expression.
(C) Wild type with ProFAMA:GUS staining in MIs.
(D) fama-1 lacks MIs. Note absence of stained linearly arranged cells. However, ProFAMA:GUS is expressed in clusters of cells (that are not stomata) but that are produced by the stomatal lineage. The roughly circular outline derives from the vasculature.
(E) A higher magnification showing ProTGG1:GUS expression in two adjacent MIs.
(F) Absence of ProTGG1:GUS staining resulting from the abrogation of MI fate by the loss of FAMA function. The elongated cells are part of the phloem.
(G) Note the absence of elongated, ProFAMA:GUS-expressing MIs in fama-1. The globular structures expressing GUS are out-of-focus epidermal cell clusters shown in (H).
(H) ProFAMA:GUS is expressed in clusters of cells (e.g., at arrow) that arise from excess symmetric divisions in GMCs in fama-1, but these cells do not form stomata.
(I) Expression of the E1728:YFPer marker in MIs.
(J) E1728:YFPer expression is absent in fama-1, which lacks MIs.
(K) Wild type showing ProFAMA:GFP fluorescence in elongated MIs.
(L) ProFAMA:GFP expression is absent from fama-1, which lacks MIs.
Images from (A) to (H) are from 4-week-old fifth to sixth rosette leaves using bright-field microscopy. (I) to (L) show confocal microscopy images of 2-week-old, third rosette leaf hydathode regions. Red fluorescence in (I) to (L) derives from PI staining in cell walls as well as from the autofluorescence of chloroplasts. Bars = 50 μm.

