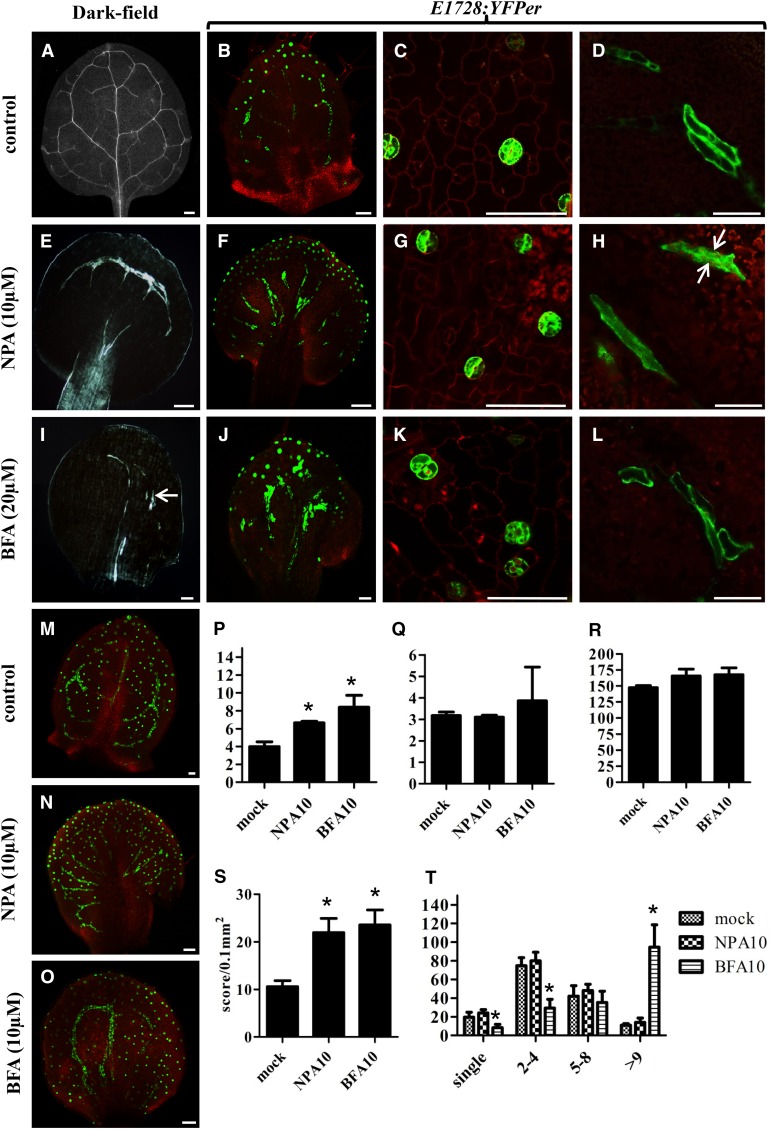
Figure 6.
Disruption of MI, Vascular, and Stomatal Patterning by the Auxin Pathway-Related Chemical Inhibitors NPA and BFA.
(A) to (O) MIs were visualized using ProFAMA:GFP fluorescence. Figures in (A) to (L) show 8 DAG first leaves grown on half-strength Murashige and Skoog medium, some of which contained the chemicals specified. (M) to (O) were as above except from 12 DAG third to fourth rosette leaves. All images in (A) to (O) were captured using confocal microscopy. Red fluorescence represents PI staining as well as autofluorescence from chloroplasts. Bars = 50 μm.
(A) Normal vascular patterning, dark-field microscopy.
(B) Normal distribution of stomata (dots in optical plane focused on stomata) as well as of linearly shaped MIs located deeper in the leaf visualized with E1728:YFPer fluorescence.
(C) and (D) Normal distribution and patterning of stomata and MIs, respectively.
(E) NPA (10 μM) collapses and radializes vascular distribution in the leaf margin and petiole. Dark-field microscopy.
(F) NPA radializes MI patterning between the leaf margin and the petiole.
(G) and (H) NPA does not significantly disrupt stomatal or MI morphology. Arrows in (H) mark two MIs in contact, a grouping also found in untreated plants.
(I) BFA (20 μM) shortens and disrupts the vasculature (arrow). Dark-field microscopy.
(J) BFA induces MI swelling and increases the number of MIs in contact.
(L) BFA induces MI swelling (cf. to length-to-width ratio of MIs in [D]).
(M) Normal distribution of stomata (dots) and MIs (lines) visualized with ProFAMA:GFP fluorescence.
(N) NPA (10 μM) radializes MI distribution between the leaf margin and petiole. MIs visualized by ProFAMA:GFP fluorescence.
(O) BFA (10 μM) increases the number of MIs in contact.
(P) Data from quantitative RT-PCR showing TGG1 transcript levels in 14 DAG mock, NPA, and BFA-treated plants. TGG1 expression was normalized to that of ACTIN2. Unpaired t tests were used to analyze statistical differences; significance at the level of P < 0.05 is indicated by an asterisk. Bars represent means of three replicates ± sd.
(Q) As in (P) except for TGG2 transcript levels.
(R) Total numbers of MIs scored from 12 DAG first leaves.
(S) Quantification of MI density in12 DAG first leaves. y axis indicates the number of MIs scored per leaf area (0.1 mm2). Each value is the mean calculated from five leaves in different plants from three biological replicates ± sd. Asterisks indicate significant differences compared with controls (mock treatment) analyzed by unpaired t tests (P < 0.01).
(T) Number of MIs in contact scored from leaves 12 DAG. x axis indicates the number of one or more MIs in direct contact. Each column represents the mean calculated from five first leaves using the ProFAMA:GFP MI marker and confocal microscopy. Bars represent the means from three replicates ± sd. Asterisks indicate statistical significance as analyzed by unpaired t tests (P < 0.01).

