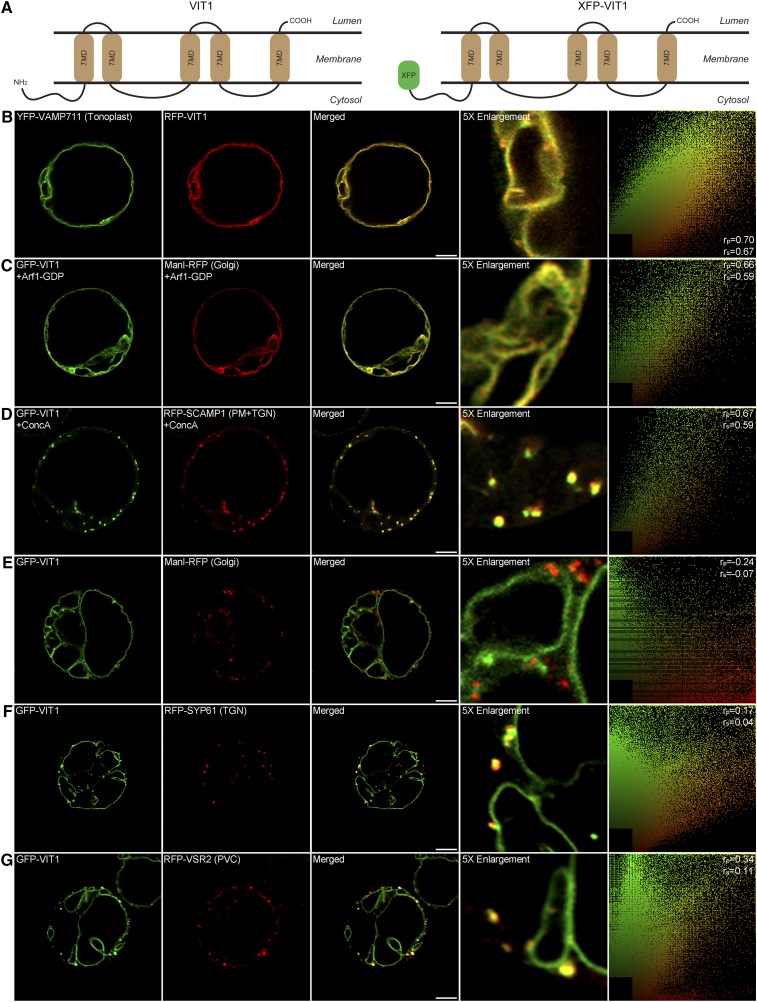
Figure 1.
Predicted Topology and Subcellular Localization of GFP-VIT1 in Arabidopsis Protoplasts.
(A) Predicted topology of Arabidopsis VIT1 as determined using the TMHMM server 2.0 and diagram of construct GFP-VIT1.
(B) to (G) GFP-VIT1 was coexpressed with known organelle markers into Arabidopsis protoplasts as indicated ([B] and [E] to [G]). Images were collected by confocal microscopy after 12 to 14 h incubation. Vesicle trafficking from Golgi and TGN was inhibited by overexpression of Arf1 mutant (C) and ConcA treatment (D). The right column shows the scatterplot images obtained from ImageJ with the PSC colocalization plug-in. The linear Pearson correlation coefficient (rp) and the nonlinear Spearman correlation coefficient (rs) indicate the extent of colocalization with the value of +1.0 for complete colocalization. Bars = 10 μm.

