Figure 2.
FAMA Is Expressed before a Mature Myrosin Cell Marker in Myrosin Cells.
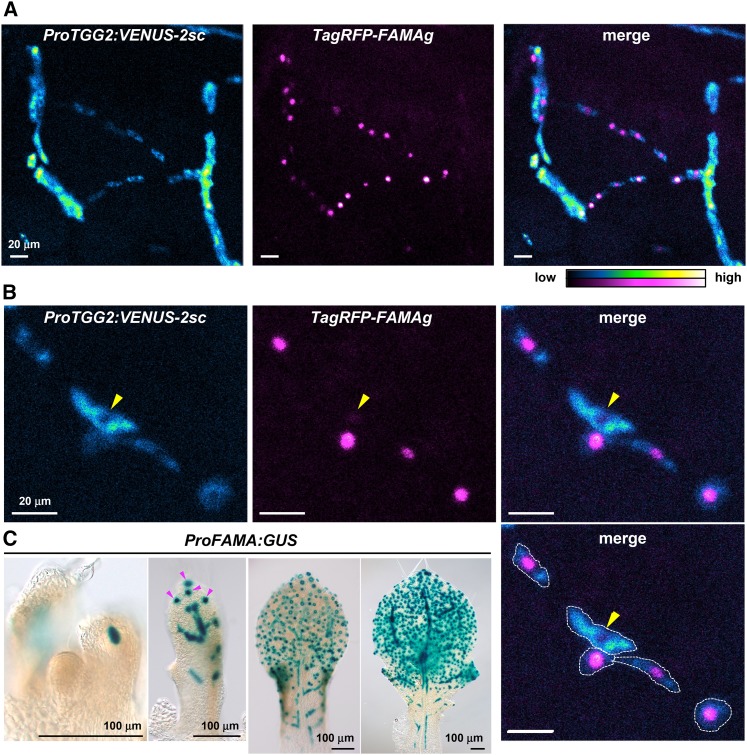
(A) and (B) Confocal images of the inner tissue of leaf primordia coexpressing both ProTGG2:VENUS-2sc (blue-to-yellow) and ProFAMA:TagRFP-FAMAg (magenta-to-white). Images are maximum intensity projections of a series of images in the Z-plane. Signal intensities are shown in blue-to-yellow or magenta-to-white according to increasing intensity levels. VENUS-2sc localizes to the endoplasmic reticulum and vacuoles, whereas TagRFP-FAMAg localizes to the nucleus. Note that very low expression of ProFAMA:TagRFP-FAMAg was found in mature myrosin cells (arrowheads in [B]). The approximate border of the myrosin cell is indicated by a white outline (lower right panel in [B]).
(C) Developmental change in ProFAMA:GUS expression pattern. Arrowheads indicate stomatal lineage cells.

