Figure 3.
Myrosin Cell Development in Leaf Primordia of fama Loss-of-Function Mutants.
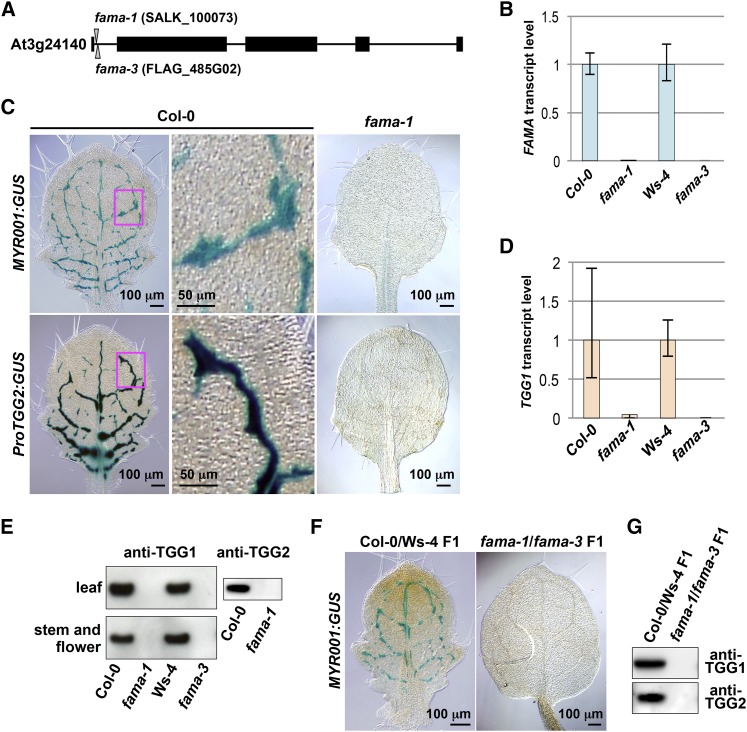
(A) Exon-intron organization of FAMA. T-DNA insertions are shown for fama-1 (SALK_100073) and fama-3 (FLAG_485G02). Closed boxes, exons; solid lines, introns.
(B) Quantitative RT-PCR of FAMA in 28 d after germination plants of fama-1, fama-3, and their respective wild-type lines (Col-0 and Ws-4) using Actin2 as a control. Error bars indicate 95% confidence intervals (n = 3).
(C) GUS staining of the rosette leaves of Col-0 and fama-1 plants expressing the myrosin cell markers MYR001:GUS (upper panels) and ProTGG2:GUS (lower panels). The boxed areas in the left panels are enlarged (middle panels).
(D) Quantitative RT-PCR of TGG1 in 28 d after germination plants of fama-1, fama-3, and their respective wild-type lines (Col-0 and Ws-4) using Actin2 as a control. Error bars indicate 95% confidence intervals (n = 3).
(E) Immunoblot analysis of rosette leaves (upper panel) and stems and flowers (lower panel) of fama-1, fama-3, and their respective wild-type lines (Col-0 and Ws-4) with anti-TGG1 antibody (left panels) and anti-TGG2 antibody (right panel).
(F) GUS staining of the rosette leaves of F1 progenies of Col-0 × Ws-4 (left panel) and fama-1 × fama-3 (right panel), both of which expressed MYR001:GUS.
(G) Immunoblot analysis of rosette leaves of the indicated F1 progenies with anti-TGG1 antibody (upper) and anti-TGG2 antibody (lower).

