Figure 6.
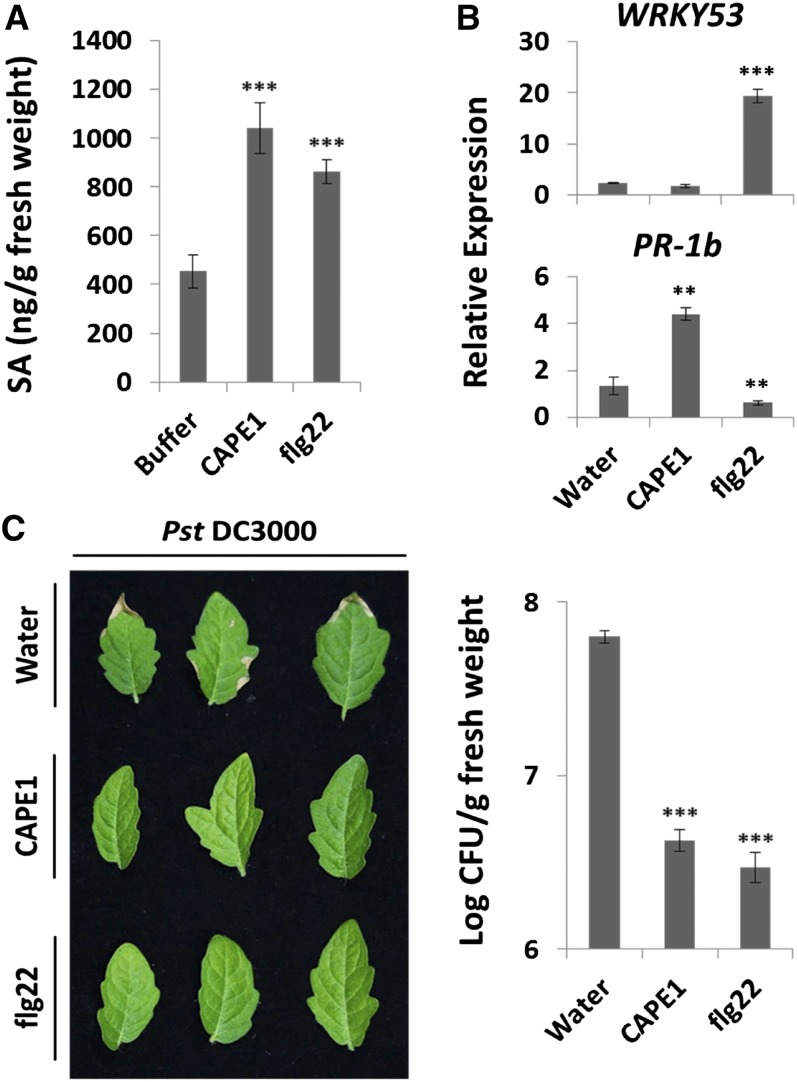
The SA Accumulation, Antipathogen Genes, and Responses Induced by CAPE1 and flg22 in Tomato.
(A) The level of SA induced by CAPE1 and flg22. The excised plants were pretreated with 10 mM phosphate buffer (buffer) or 365 nM CAPE1 or 365 nM flg22 in buffer through the cut stem for 8 h (n = 3). The quantity of SA was quantified by LC-SRM-MS and calculated based on the abundance of spiked SA isotopic standard (d6-SA).
(B) The relative expression of WRKY53 and PR-1b were quantified by comparing the expression levels in untreated detached leaves with the detached leaves treated with water, 250 nM CAPE1, or 250 nM flg22 for 2 h (n = 4). The internal control Ubi3 was used for normalization.
(C) The Pst DC3000 infection phenotypes for plants presprayed with water, 100 nM CAPE1, or 100 nM flg22 peptide for 2 h (n = 3) prior to the pathogen inoculation. The infection symptoms were observed 4 d after inoculation. The bacterial numbers were calculated 4 d after inoculation and represented as log colony-forming units (Log CFU) per gram leaf tissue. Data represent the means and sd of three biological samples. A statistically significant difference compared with the correspondingly treated water (or buffer) samples is indicated with asterisks, **P < 0.01 or ***P < 0.001, based on Student’s t test.

