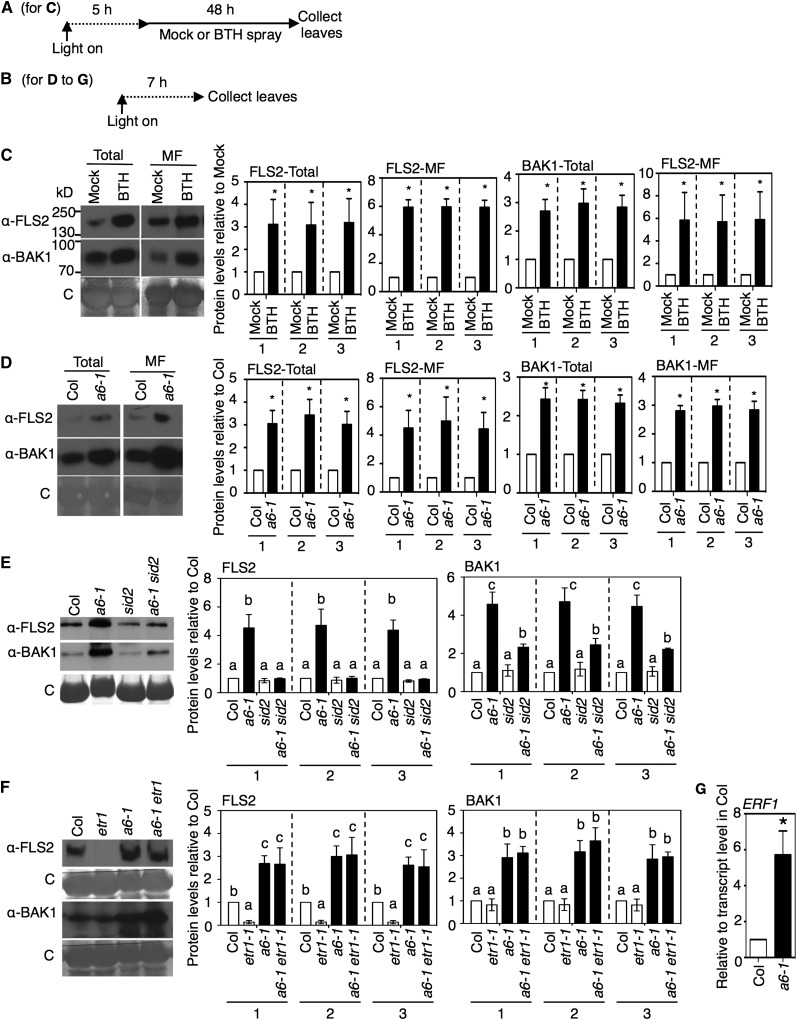
Figure 2.
Effects of acd6-1, SA Accumulation, and/or SA Agonist Treatment on PAMP (Co)Receptor Levels.
(A) and (B) Chemical treatment and plant tissue collection schemes for the indicated panels: (A) for (C); (B) for (D) to (F).
(C) FLS2 and BAK1 protein levels after BTH treatment of the wild type (Col). Leaves were collected 48 h after spray treatment with 100 μM BTH or mock treatment. Total and microsomal fraction (MF) proteins isolated from plants were analyzed by immunoblotting with FLS2 and BAK1 antibodies.
(D) FLS2 and BAK1 protein levels in Col and acd6-1 (a6-1). Proteins were extracted and analyzed as in (C).
(E) and (F) Effects of sid2-1 and etr1-1 mutations on FLS2 and BAK1 protein levels in acd6-1. Microsomal proteins isolated from Col, acd6-1, sid2-1, acd6-1 sid2-1, etr1-1, and acd6-1 etr1-1 plants were analyzed as in (C).
(G) Transcript level of ERF1, an ethylene-responsive marker gene, in acd6-1 relative to the wild type determined by qRT-PCR using three biological repeats.
Graphs in (C) to (F) show the mean fold change in receptor levels (normalized to total protein [1], Rubisco [2], or all proteins except Rubisco [3]) of the indicated plants relative to mock (C) or the wild type (Col) ([D] to [F]), quantified from immunoblots using three independent experiments. Dotted lines in (C) and (D) indicate separate comparisons with the respective mock (C) and Col (D) values in the total and microsomal fraction, respectively. Error bars show se. *P < 0.05; letters above bars represent significance groups as determined by the Newman-Keuls multiple comparison test, P < 0.05 or better ([E] and [F]). C, Coomassie blue stained. These experiments were repeated three times with similar results.

