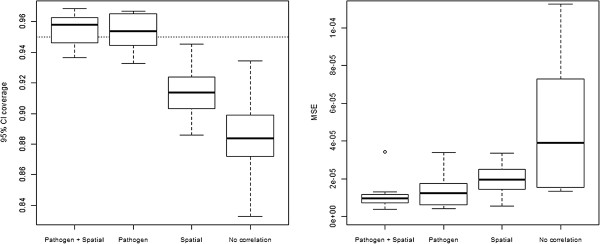
Figure 2.

The ‘Pathogen + Spatial’ model had the best out-of-sample predictive skill. Left panel depicts 95% CI coverage, defined as the proportion of out-of-sample observations that fell within the estimated predictive 95% CI. Dotted horizontal line depicts the target CI coverage. Right panel depicts the Mean Squared Error (MSE) for each model. A description of each model is provided in Table 1.
