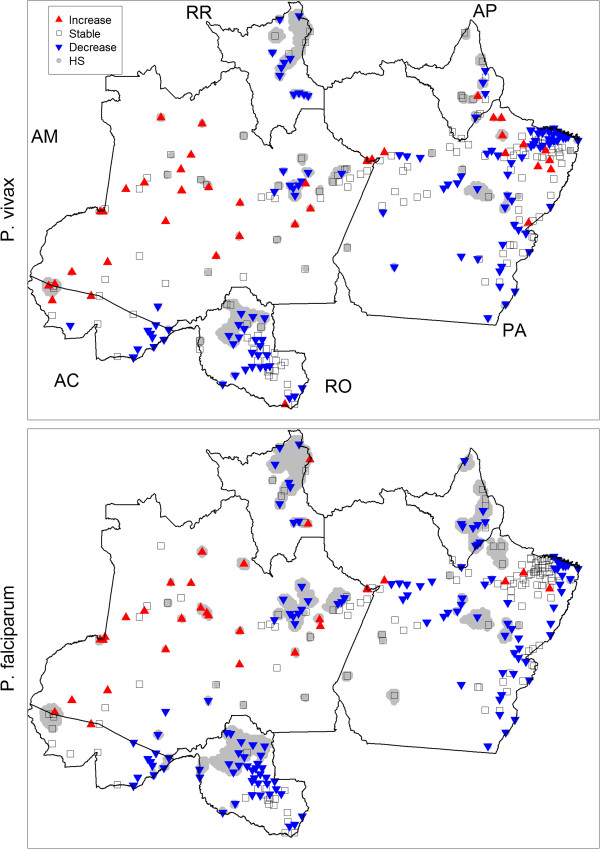
Figure 6.

Malaria risk is declining throughout most of the Brazilian Amazon region except for Amazonas state. Areas where the estimated malaria risk significantly increased or declined from 2004 to 2008 are shown with red and blue triangles, respectively. Areas with no significant change (‘stable’) are shown with empty squares. Intermittent and persistent hotspots from Figure 5 are shown in grey in the background. Letters indicate state names (AC = Acre, AM = Amazonas, RR = Roraima, AP = Amapa, PA = Para, and RO = Rondonia).
