
Figure 1.
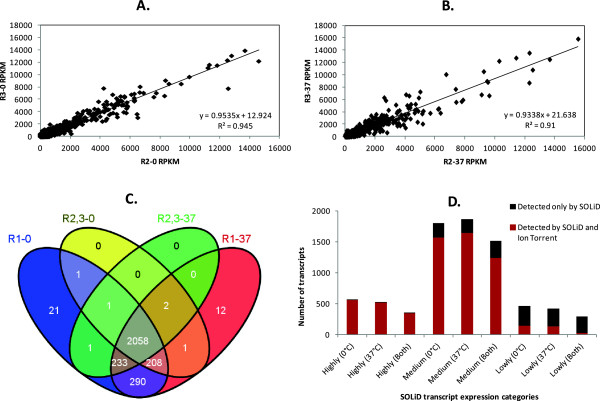
Absolute expression analysis by SOLiD RNA-Seq and Ion Torrent RNA-Seq. The upper panels describe the correlation between the biological replicates sequenced on the Ion Torrent platform at temperatures of 0°C (A) and 37°C (B). (C) Venn diagram showing the total number of expressed regions in each replicate set. (D) Correlation between the expression levels of transcripts detected by SOLiD (Highly expressed, RPKM ≥500; Moderately expressed, 10 ≤ RPKM <500; Lowly expressed, 0 < RPKM <10) and those detected by Ion Torrent at each or both temperature conditions.