
Figure 5.
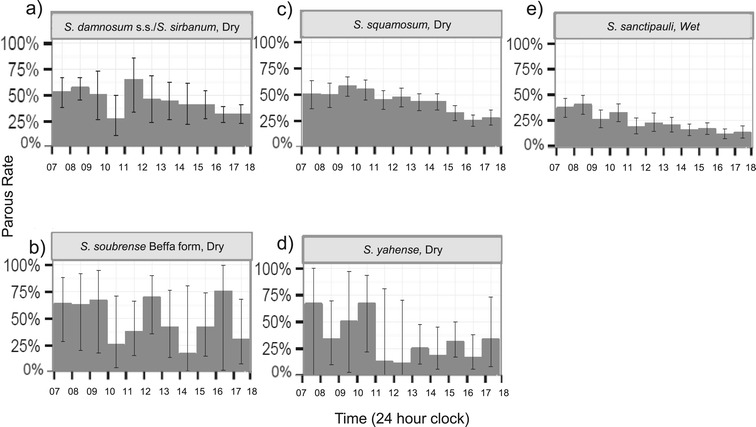
Diurnal distribution of the proportion of parous flies for each sibling species. The x-axis shows the time (hourly), and the y-axis, the parous rate per hour (%). Parous rates calculated from all trapping methods combined. The number of flies of each species dissected per season varied and are presented for each species for the season with the larger sample sizes and greater confidence in the data: a) S. damnosum s.s./S. sirbanum; dry season n = 603, b) S. soubrense Beffa form dry season n = 260, c) S. squamosum dry season n = 1,506; d) S. yahense dry season n = 191; and e) S. sanctipauli wet season n = 1,563. Graphs for all species for both seasons are shown in ‘Additional file 2’.