Figure 4.

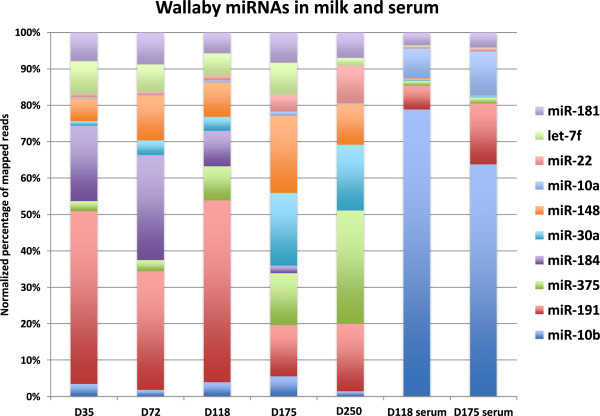
Wallaby milk miRNA abundance profiles at 5 lactation time points and two serum samples matched to the milk samples. Bar diagram illustrating the normalized percentage of mapped reads.

Wallaby milk miRNA abundance profiles at 5 lactation time points and two serum samples matched to the milk samples. Bar diagram illustrating the normalized percentage of mapped reads.