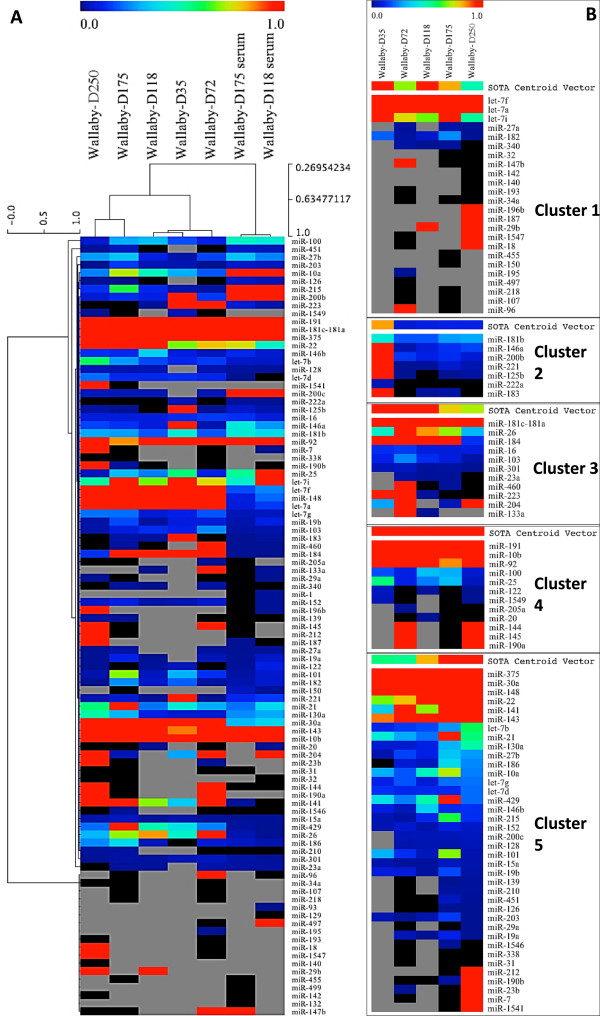
Figure 6.

Clustering of wallaby milk and serum miRNA profiles by Hierarchical Clustering Linkage method: (single linkage Pearson correlation). (6A) Grey colour in the heat maps denotes the absence of miRNA and black colour indicates miRNAs below 0.001%. (6B) Milk miRNA clustering into 5 clusters illustrating individual miRNA expression.
