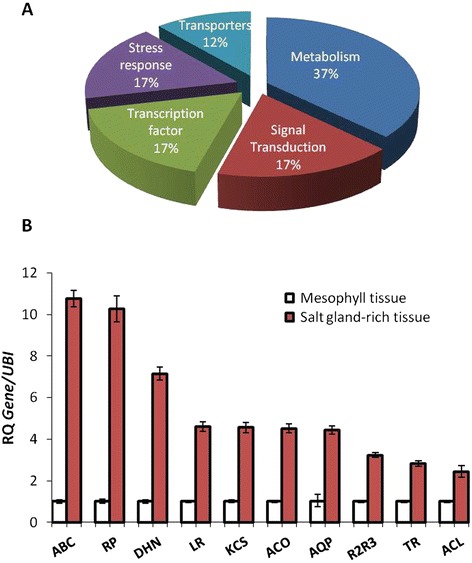
Figure 1.

Classification of differentially expressed ESTs and expression analysis of selected ESTs. (A) Distribution of ESTs obtained from subtractive hybridization of salt gland rich-tissue and mesophyll tissue from A. officinalis leaves. (B) Expression profile of selected EST’s enriched in salt glands by qRT-PCR analysis of transcripts from mesophyll tissue vs. salt gland rich-tissue. White-brown-complex ABC transporter family (ABC), Ribosomal protein S6 (RP), Dehydrin (DHN), Leucine-rich repeat protein kinase (LR), 3-ketoacyl-CoA synthase (KCS), 1-aminocyclopropane-1-carboxylate oxidase (ACO), Aquaporin (AQP), Transcription factor R2R3 (R2R3), Thioredoxin H (TR), ATP Citrate Lyase (ACL) RQ – Relative quantification (mean ± SE, n = 3).
