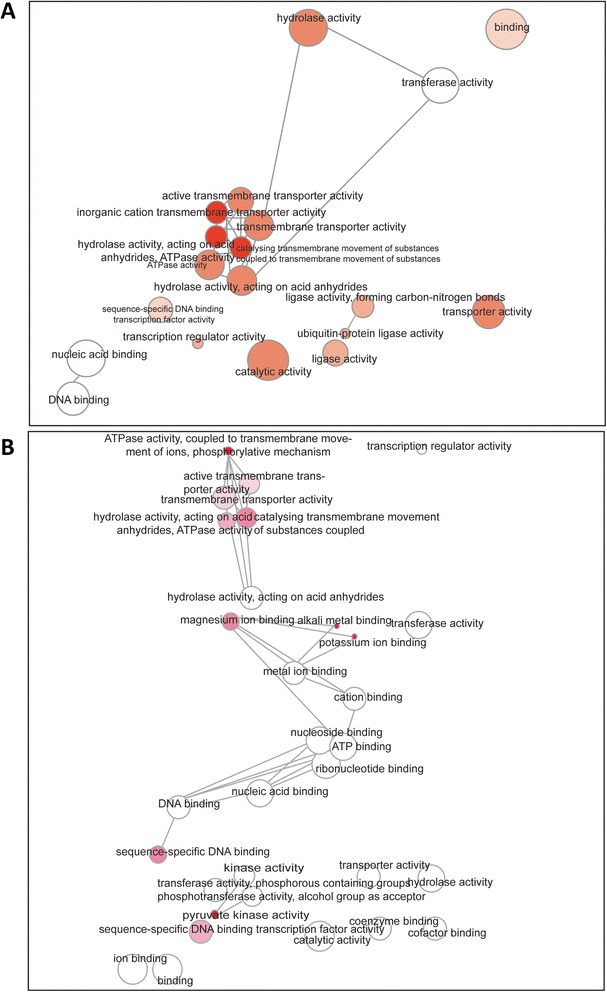
Figure 2.

Functional gene-network analysis of the ESTs identified from subtractive hybridization. Interactive graph was generated using web-tool REVIGO (http://revigo.irb.hr/) as on 9th December 2013. The bubble colour indicates the p-value as generated by Singular Enrichment Analysis of the Gene Ontology (GO) terms obtained from the web-tool agriGO (http://bioinfo.cau.edu.cn/agriGO/analysis.php). The gene IDs that resulted by blasting the ESTs against (A) Arabidopsis and (B) Poplar cDNA libraries were used to generate the GO terms. Bubble size indicates the frequency of the GO term. Highly similar GO terms are linked by edges in the graph, where the line width indicates the degree of similarity.
