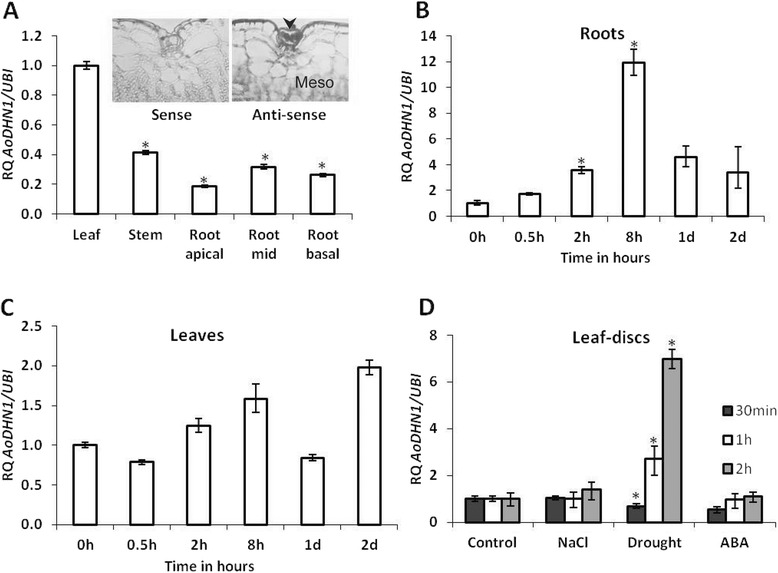
Figure 6.

Expression profile of AoDHN1. (A) Tissue-specific expression of AoDHN1 transcripts from two-month-old greenhouse-grown plants. (Inset to A) In situ hybridization of leaf tissue, showing high abundance of AoDHN1expression in the salt glands (n = 3). Arrowhead indicates the salt gland, and mesophyll cells are labeled as Meso. (B) Expression kinetics of AoDHN1 upon salt stress in roots. (C) Expression kinetics of AoDHN1 upon salt stress in leaves. (D) Expression analysis of AoDHN1 in the A. officinalis leaf-discs upon treatment with salt (NaCl), drought and ABA. Asterisks indicate a significant difference in expression levels as indicated by Student’s t-test (p < 0.05). RQ-Relative quantification data representing mean ± SE (n = 3).
