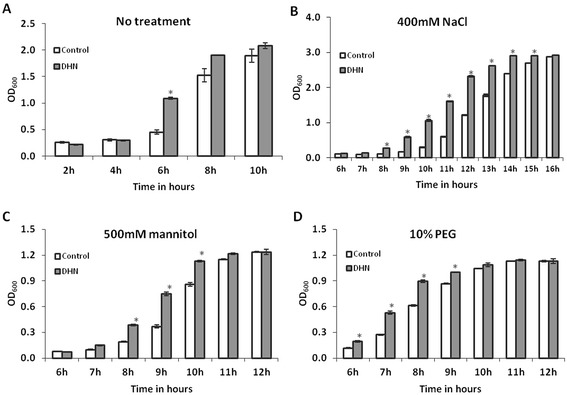
Figure 8.

Comparison of growth of E. coli cells expressing AoDHN1 under salt and drought stress conditions. Salt stress was simulated by 400 mM NaCl, and drought conditions were provided by 500 mM mannitol and 10% polyethylene glycol (PEG). E. coli BL21 cells expressing AoDHN1 showed significant differences in cell densities compared to control cells which do not express AoDHN1 over specified periods of time. (A) without any treatment (B) with 400 mM NaCl treatment (C) with 500 mM mannitol treatment and (D) with 10% PEG 4000 treatment. Data are mean ± SE (n = 3). Asterisks indicate a significant difference in cell densities as indicated by Student’s t-test (p < 0.05). OD – Optical Density.
