Figure 5.

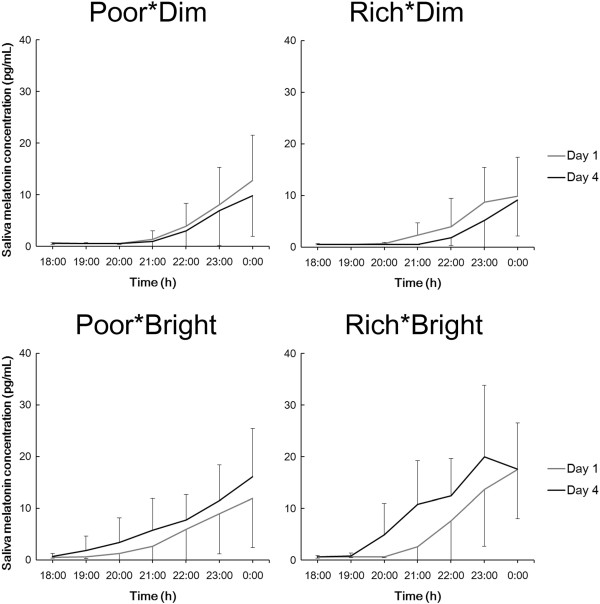
Average saliva melatonin concentrations (and SDs) during the evenings of days 1 and 4 in each group. Note that the data show the same as those in Figure 4.

Average saliva melatonin concentrations (and SDs) during the evenings of days 1 and 4 in each group. Note that the data show the same as those in Figure 4.