
Figure 1.
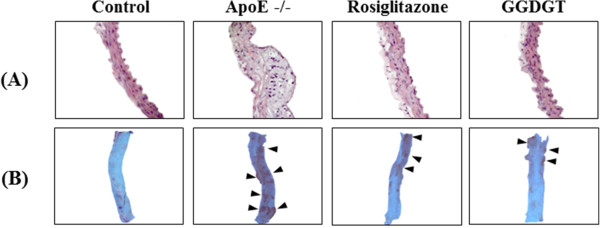
Representative images showing aortic histology in control, ApoE-/-, rosiglitazone-treated, and GGDGT-treated mice at week 12. The upper panel (A) indicates haematoxylin and eosin (H&E) staining (×400) in cross-section, and the lower panel (B) indicates Oil-red O staining (×100) (n = 6). The lipid accumulation (violet colour) is indicated by an arrow in the Oil-red O staining.