Figure 3.

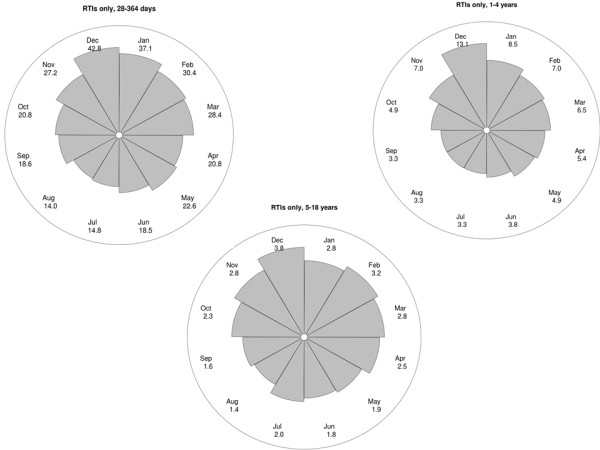
Circular plot of monthly RTI-related mortality rates by age group (per 100,000 population). The distance from the centre of the circle to the edge is proportional to the mortality rate.

Circular plot of monthly RTI-related mortality rates by age group (per 100,000 population). The distance from the centre of the circle to the edge is proportional to the mortality rate.