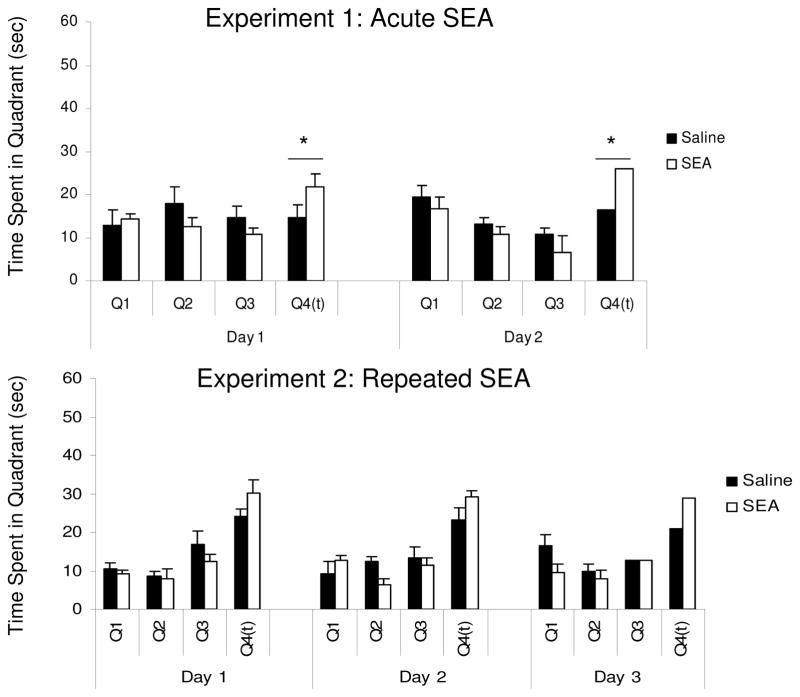
Figure 3.
Relative amounts of time (in seconds) spent in the four quadrants of the morris water maze during probe trials given during the relearning phase one month after initial training. Each probe trial was given for 60 seconds, and Q4(t) indicates the quadrant where the platform was normally present. Each bar represents the mean (+/− standard error of the mean) of N= 8 animals per group. In both experiments, the SEA group showed a statistically significant higher preference (* p < 0.05) for the target quadrant (as determined by a ANOVA conducted on the Q4(t) time data, see Results).

