
Figure 6.
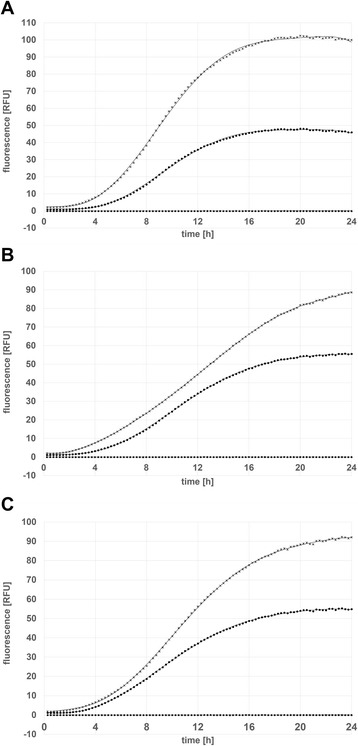
Comparison of mCherry expression levels for the constructs pCDLbu_1ΔEc and pCD256ΔEc in L. plantarum CD033 measured using BioLector ™ platform: mCherry under control of promoter (A) P11: (♦) L. plantarum CD033 negative control pCDLbu-1∆Ec_mCherry, (▲) L. plantarum CD033 negative control pCD256∆Ec_mCherry, (×) L. plantarum CD033 pCDLbu-1∆Ec_P11_mCherry, (●) L. plantarum CD033 pCD256∆Ec_P11_mCherry (B) Ptuf33: (♦) L. plantarum CD033 negative control pCDLbu-1∆Ec_mCherry, (▲) L. plantarum CD033 negative control pCD256∆Ec_mCherry, (×) L. plantarum CD033 pCDLbu-1∆Ec_Ptuf33_mCherry, (●) L. plantarum CD033 pCD256∆Ec_Ptuf33_mCherry and under control of promoter (C) Ptuf34: (♦) L. plantarum CD033 negative control pCDLbu-1∆Ec_mCherry, (▲) L. plantarum CD033 negative control pCD256∆Ec_mCherry, (×) L. plantarum CD033 pCDLbu-1∆Ec_Ptuf34_mCherry, (●) L. plantarum CD033 pCD256∆Ec_Ptuf34_mCherry.