
Figure 7.
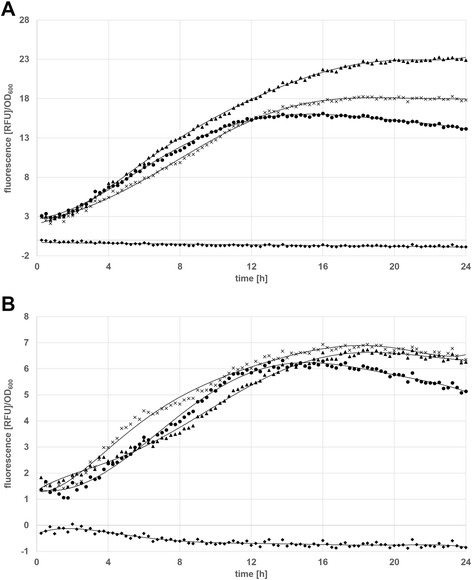
Specific expression rates of the pCDLbu_1ΔEc and pCD256ΔEc constructs in L. plantarum CD033 determined with the BioLector ™ . (A) pCDLbu_1ΔEc constructs: (▲) L. plantarum CD033 pCDLbu-1∆Ec_ Ptuf33_mCherry, (×) L. plantarum CD033 pCDLbu-1∆Ec_Ptuf34_mCherry, (●) L. plantarum CD033 pCDLbu-1∆Ec_P11_mCherry (♦) L. plantarum CD033 negative control pCDLbu-1∆Ec_mCherry (B) pCD256ΔEc constructs: (×) L. plantarum CD033 pCD256∆Ec_Ptuf34_mCherry, (▲) L. plantarum CD033 pCD256∆Ec_Ptuf33_mCherry, (●) L. plantarum CD033 pCD256∆Ec_P11_mCherry, (♦) L. plantarum CD033 negative control pCD256∆Ec_mCherry.