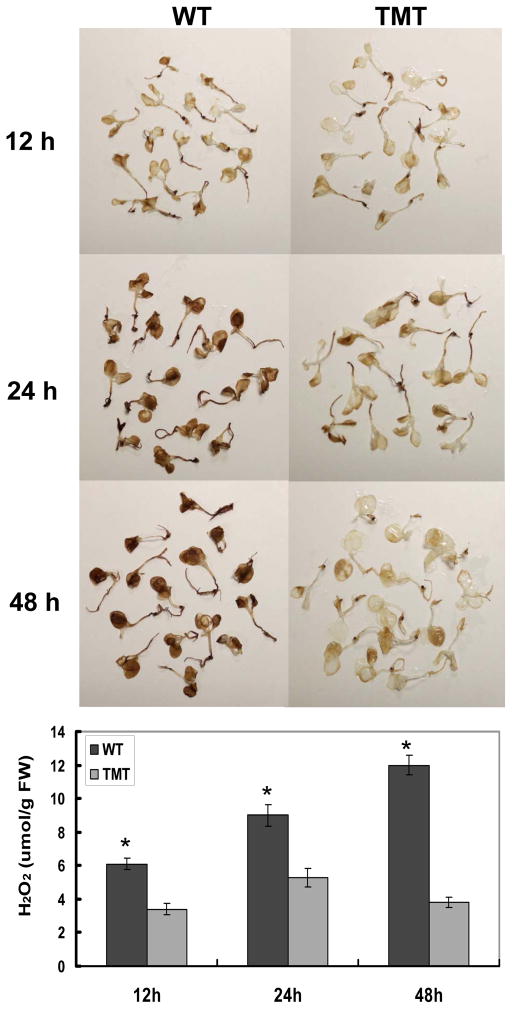
Figure 7.
Visualization and quantification of hydrogen peroxide by DAB staining. Three-week-old MS-grown wild-type and TMT transplastomic plantlets were subjected to 300 mM NaCl for 12, 24 or 48 hours and then were visualized by DAB staining. For each group, 15 plantlets are shown. Quantification of generated H2O2 after NaCl treatment were repeated 3 times (15 plantlets were used in each experiment). The data shown are means and SD from three independent experiments. *, P< 0.05.

