
Figure 1.
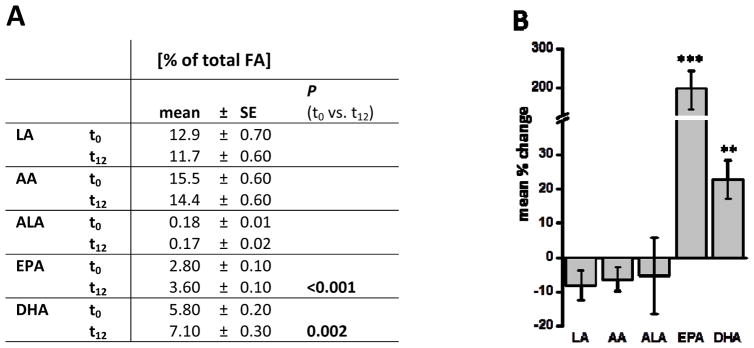
Pre- and post-treatment LC PUFA status of subjects (n=10). A) Ratio of LC PUFAs in erythrocyte membranes at baseline (t0) and after twelve weeks (t12) of treatment with LC n-3 PUFA. B) Mean relative change of LC PUFA ratios after LC n-3 PUFA treatment on individual level. All results are shown as the mean ± SE. Significant differences between the two time points were determined by dependent sample t-test.