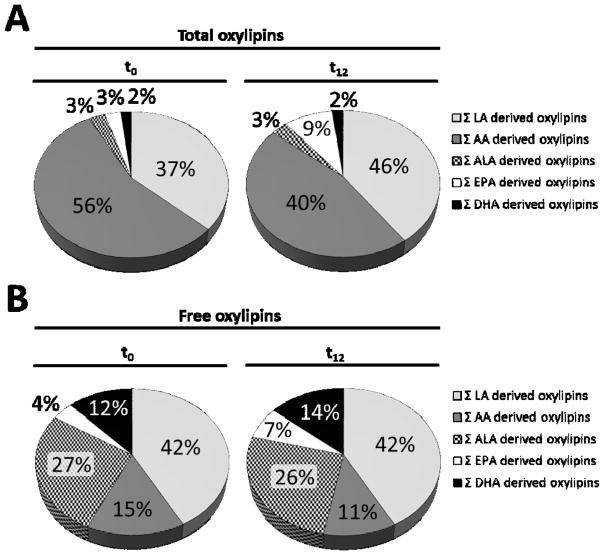
Figure 3.
Relative distribution of all analyzed oxylipins with respect to their precursor LC PUFA. Shown is the pattern for A) total and B) free plasma oxylipins at baseline (t0) and after twelve weeks (t12) of treatment with LC n-3 PUFA. The relative distribution was calculated based on the sum of median concentrations of measured LA-, AA-, ALA-, EPA- and DHA- derived oxylipins.

