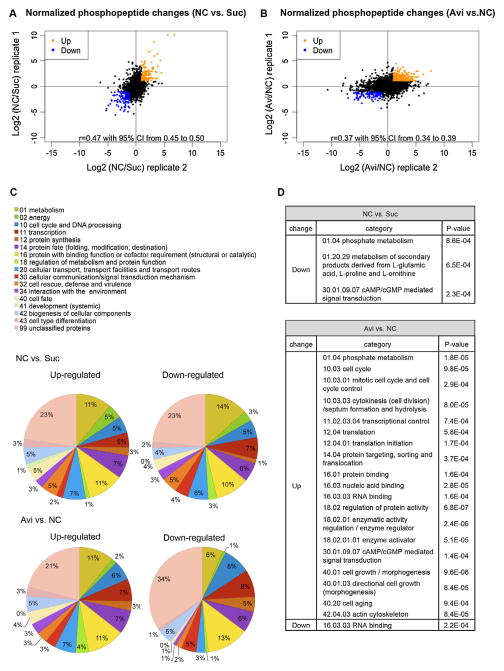
Fig. 4.
Fold changes of phosphopeptides after normalization with protein abundance changes and functional category analysis of differential phosphorylated proteins. (A) Data from duplicate samples for fold changes in phosphopeptide abundance for no carbon (NC) vs sucrose (Suc) and (B) Avicel (Avi) vs no carbon (NC) were well correlated (rp = 0.47 and rp = 0.37 respectively). (A and B) Phosphopeptides with ≥2-fold changes were considered differentially phosphorylated and labeled in orange for increased abundance vs in blue for decreased abundance. Phosphopeptides with less than 2-fold changes were labeled in black. (C) FunCat (Ruepp et al., 2004) analysis of proteins with differential phosphorylation levels. Pie charts show percentages of phosphoproteins in each functional category. (D) Enrichment of phosphoproteins in particular functional categories.

